Categories
Articles Windows Server

Obtaining an SSL Certificate on Windows IIS Server Using “Certify the Web”

One of the crucial steps towards securing data traffic on the internet is to use SSL/TLS certificates on your websites. These certificates ensure encrypted data transmission and enable users to interact with your site securely. For Windows-based IIS servers, you can utilize the free tool “Certify the Web” to acquire and manage SSL certificates. Here’s a step-by-step guide on how to obtain an SSL certificate using the Certify the Web tool:

Step 1: Downloading and Installing Certify the Web

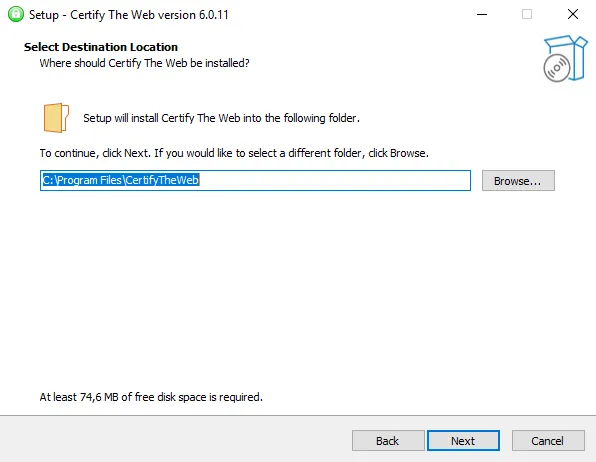
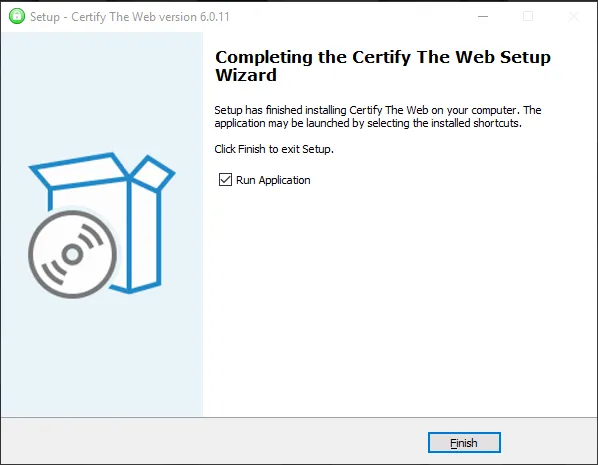
  1. Visit the official Certify the Web website and download the program. Proceed with the installation on your computer.
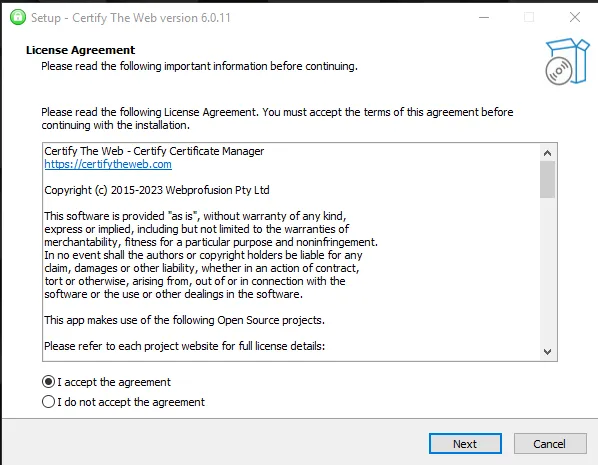
Certify the Web — 01
Certify the Web — 02
Certify the Web — 03
Certify the Web — 04

Step 2: Opening the Tool and Basic Configuration

1.Launch the Certify the Web application.
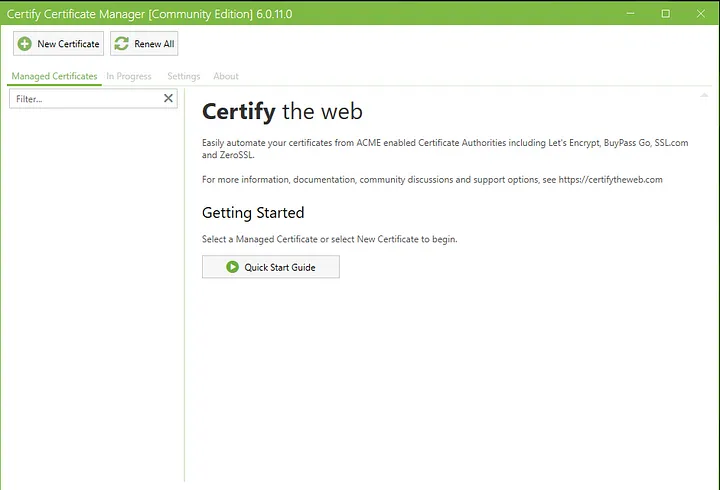
Certify the Web — 05

2. On the main screen, you’ll typically find an option like “New Certificate” or something similar. Click on this option to initiate the process of creating a new certificate.
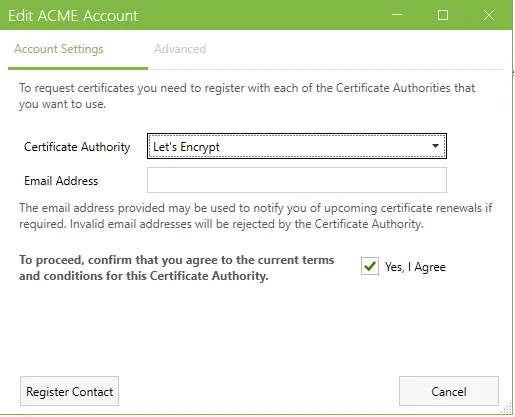
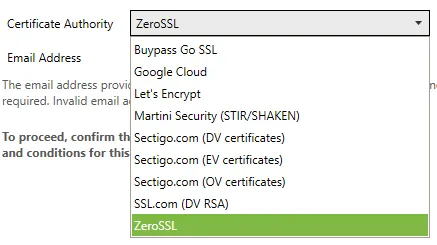
Certify the Web — 06
Certify the Web — 07

Step 3: Domain Selection and Verification Methods

1.During the certificate creation process, you should add the domain names you wish to protect (e.g., www.example.com).
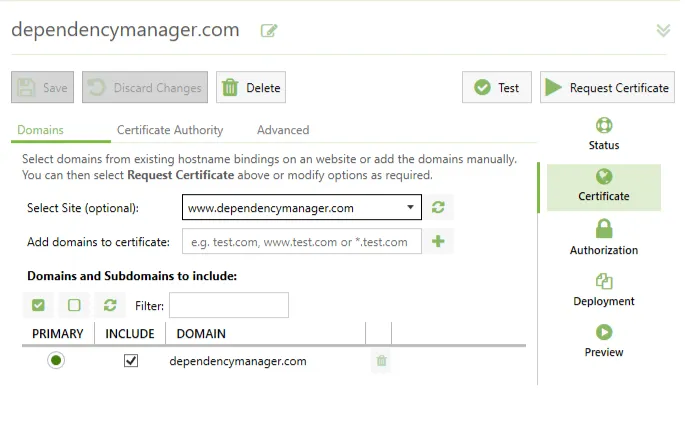
Certify the Web — 08

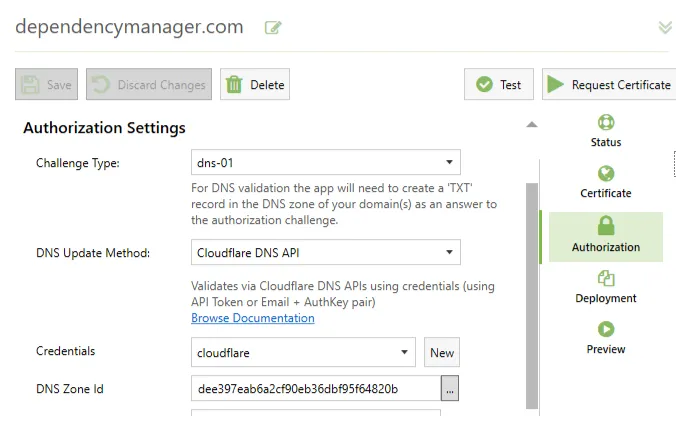
2.Certify the Web offers various methods to verify the ownership of your domain. Choose one of these methods. Usually, you can opt for HTTP or DNS-based verification methods.
HTTP-Based Verification:

  1. When HTTP-based verification is selected, Certify the Web will automatically create a special file in a designated folder on your server. This file is used to verify that your domain is accessible.

DNS-Based Verification:

  1. If DNS-based verification is chosen, you might need to create a specific DNS record. This record assists the certificate provider in verifying the ownership of your domain.

Step 4: Certificate Issuance and Installation

1.Once the verification process is completed, Certify the Web will automatically obtain the SSL/TLS certificates.
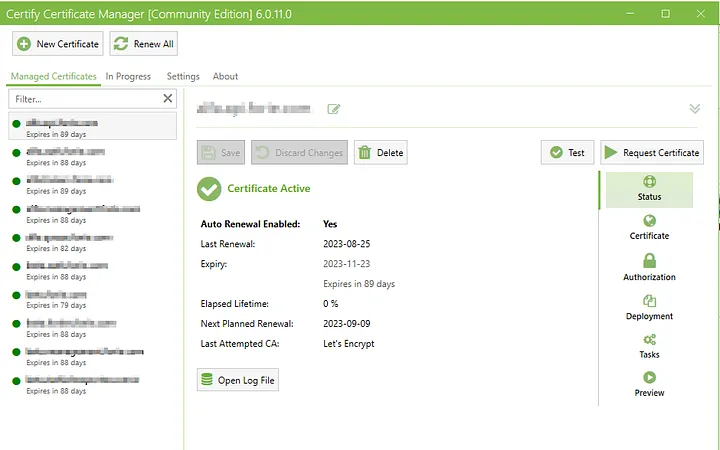
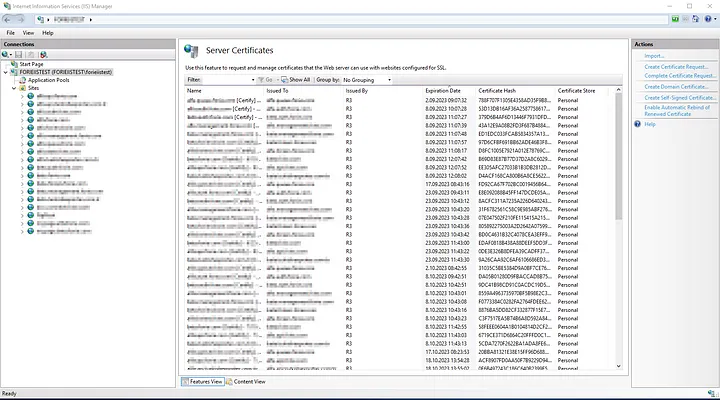
2.To manage the generated certificates and install them on your IIS server when needed, you can use the “Certificates” or a similar tab or menu.
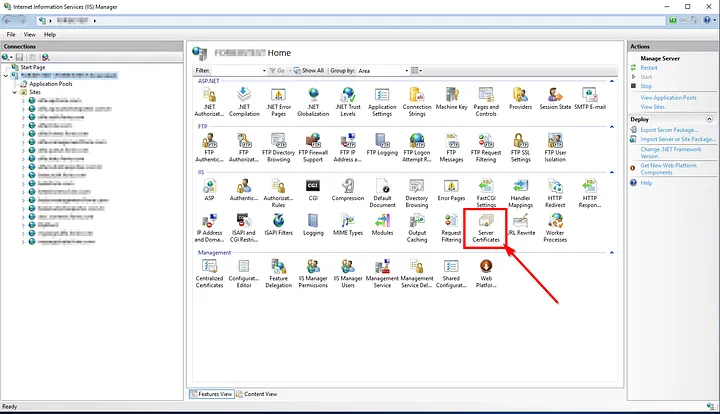
IIS Server
IIS Server
IIS Server / Server Certificates

Step 5: Using the Certificate on the IIS Server

1.While Certify the Web handles the certificate issuance, you need to activate these certificates on your IIS server.
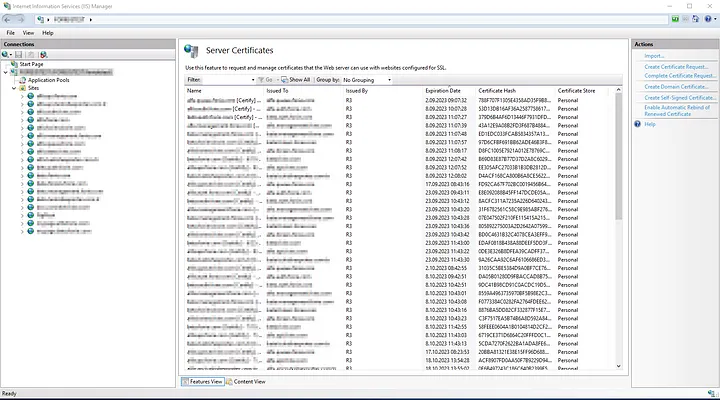
2.In the IIS management interface, navigate to the connection security settings of the relevant website.
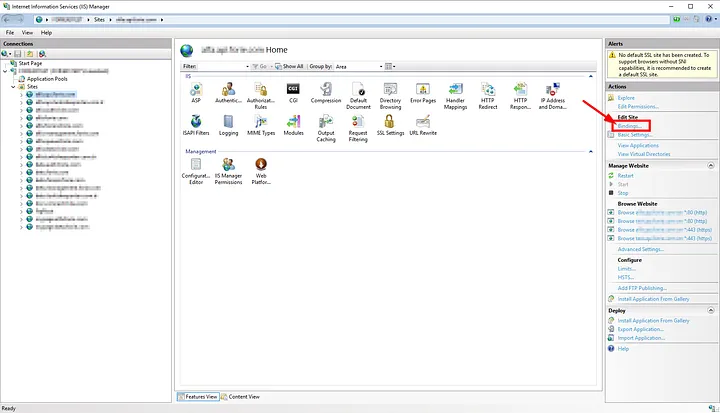
IIS Server — Binding

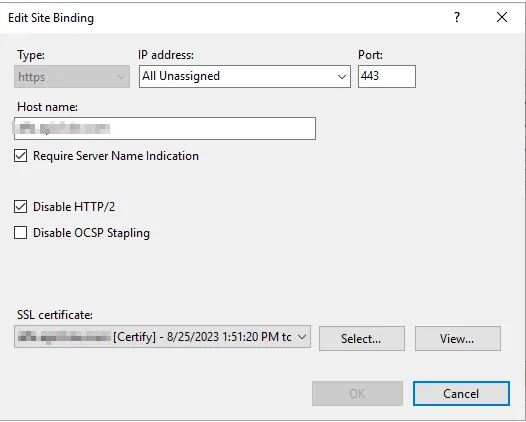
3.Select the newly acquired SSL/TLS certificate as the server certificate.
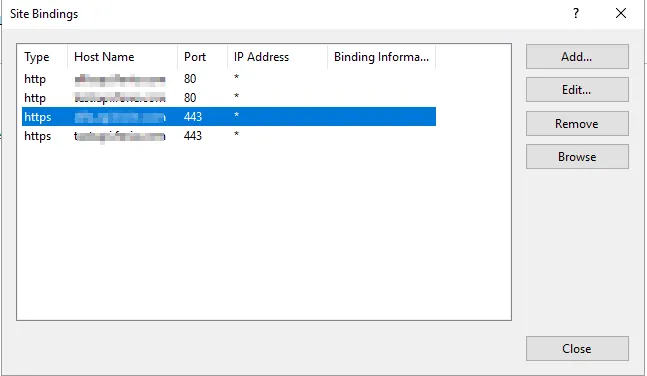
Site Binding
Site Binding
Edit Site Binding
Edit Site Binding

Data security is a paramount concern while managing your online presence. The Certify the Web tool simplifies the process of SSL certificate acquisition and management by making it easy and automated.


If you have any questions or details you would like to add, feel free to write me.
Categories
Articles Monitoring Windows Server

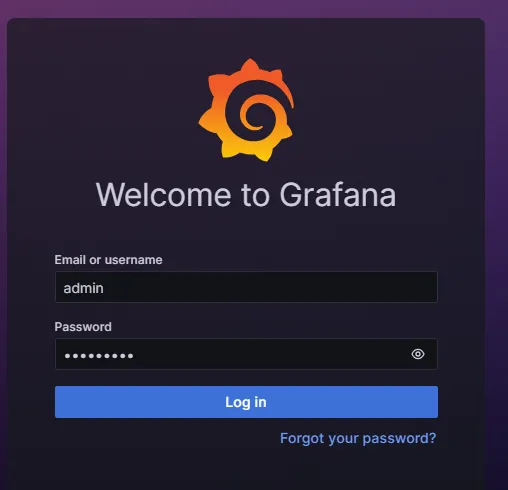
Resetting Grafana Password on Windows Server

1. Download the Grafana Password Reset Tool:

The first step is to download the official Grafana password reset tool. This tool is typically included with the Grafana installation. You can download it from the following link:

Grafana Password Reset Tool

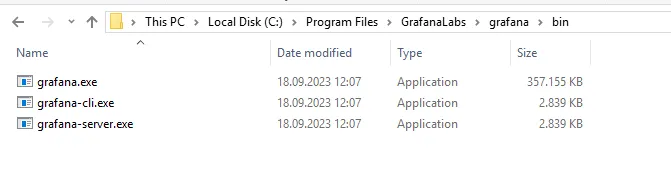
2. Run It in the Command Prompt:

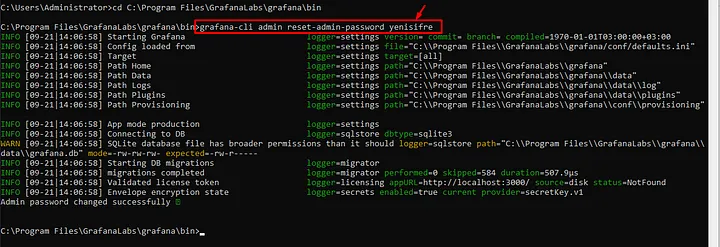
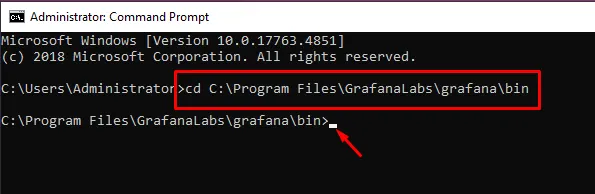
  • Navigate to the directory where Grafana is installed:

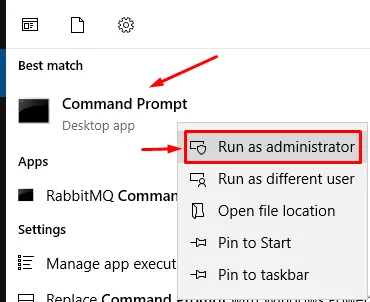
  • Run the Command Prompt as an administrator.

  • o to the relevant directory.

3.Execute the Command:

  • You can reset the Grafana password by using the following command:
Grafana-cli admin reset-admin-password YENI_SIFRE
  • Replace `NEW_PASSWORD` with your new password.

4. Log In with the New Password:

Once the password reset process is complete, you can log in to Grafana with your new password.


If you have any questions or details you would like to add, feel free to write me.
Categories
Articles Monitoring Windows Server

Part IV — RabbitMQ Monitoring Guide on Windows Server: Using Prometheus, Grafana

RabbitMQ is message queuing software that plays a significant role in distributed systems. You can access the article where I explain the RabbitMQ installation from here. You can use tools like Prometheus, Grafana, and WMI Exporter to monitor and analyze the performance of RabbitMQ servers in a Windows Server environment. Here is a step-by-step guide:

Step 1: Enabling the Built-in Plugin for RabbitMQ with Prometheus Support

RabbitMQ comes with built-in Prometheus and Grafana support.

The rabbitmq_prometheus plugin provides Prometheus metric collector support. It exposes all RabbitMQ metrics in Prometheus text format on a specific TCP port.

  • If the plugin is not already installed, navigate to the rabbitmq directory on your system and check the plugins folder for the rabbitmq_prometheus plugin.

If it’s not there, you can find the plugin in the official RabbitMQ plugin repository.


In our previous article, you can find information on how to perform monitoring on a Windows server


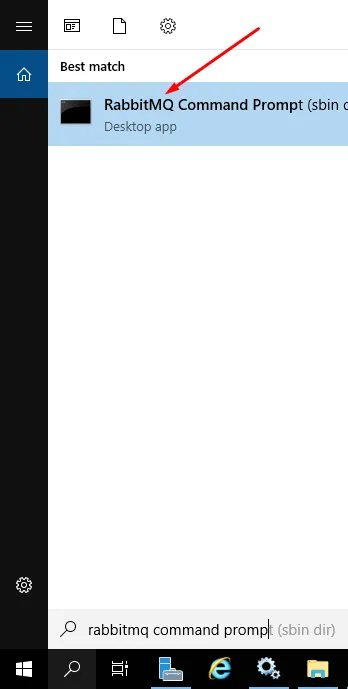
  • Open the RabbitMQ Command-Line Client.

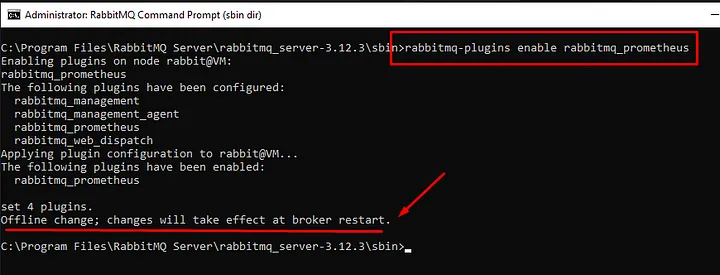
  • Enable the plugin by entering the following command:
rabbitmq-plugins enable rabbitmq_prometheus
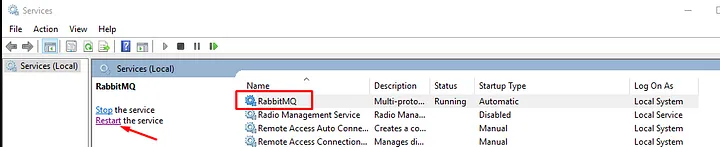
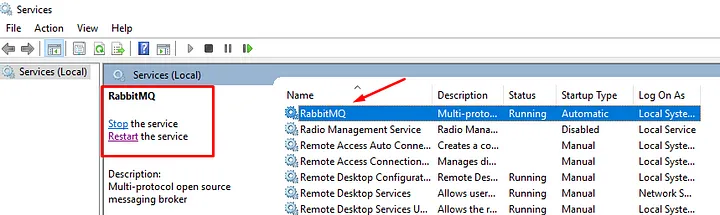
  • After enabling the plugin, you might need to restart the RabbitMQ server to activate it. To restart the server, access the service management, select RabbitMQ, and click on the restart button.
RabbitMQ restart
RabbitMQ restart
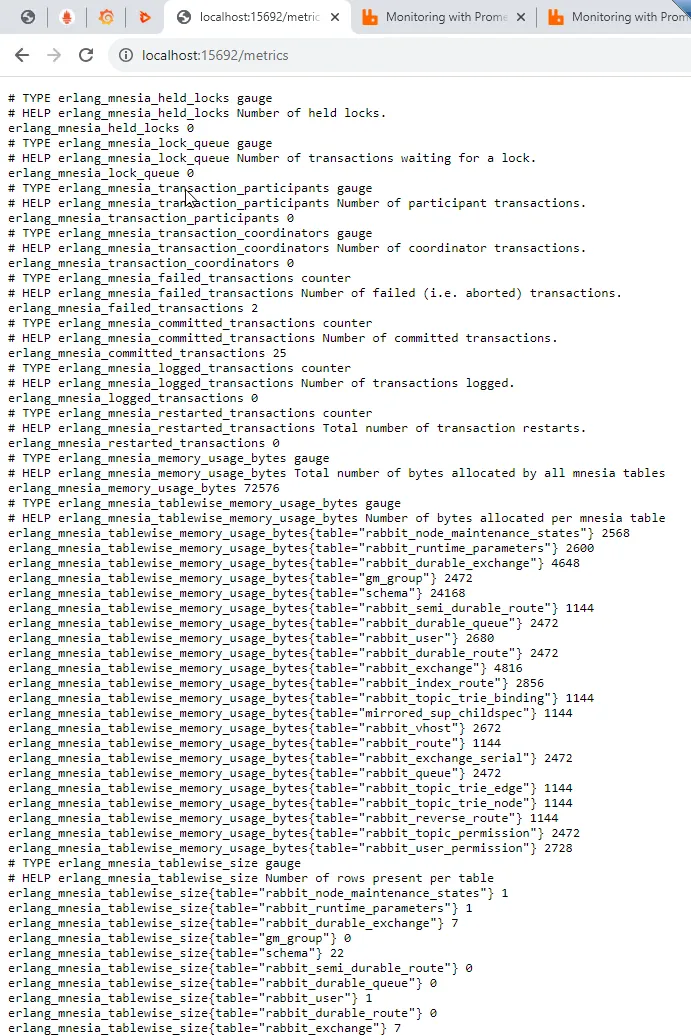
  • Finally, check the metrics by going to the address localhost:15962/metrics

Step 2: Installation and Configuration of Prometheus

  • Download and install Prometheus on your Windows Server.
  • Create a configuration file named prometheus.yml.
  • In the prometheus.yml configuration file, add a scrape “job” to monitor RabbitMQ:
scrape_configs:
  - job_name: 'rabbitmq'
    static_configs:
      - targets: ['rabbitmq-sunucu:15672'] # RabbitMQ Yönetim Arayüzü adresi
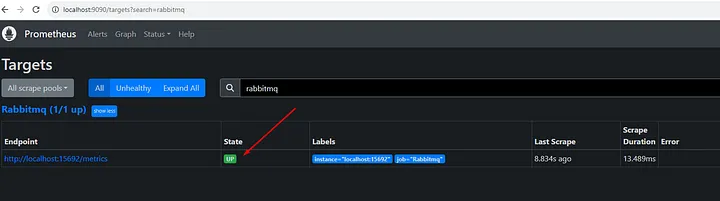
  • Verify the RabbitMQ connection added in the Prometheus web interface at localhost:9090. Check the Status/Targets section to ensure the RabbitMQ scrape target is present.

Step 3: Installation and Configuration of Grafana

  1. Download and install Grafana on your computer.
  2. Access the Grafana interface.
  3. Add Prometheus as a data source:
    • Open the side menu by clicking on the gear icon or pressing “Ctrl + Shift + ,”.
    • Go to “Data Sources”.
    • Click on the “Add data source” button.
    • Choose “Prometheus” from the list of available data sources.
    • Configure the Prometheus connection details and save the data source.

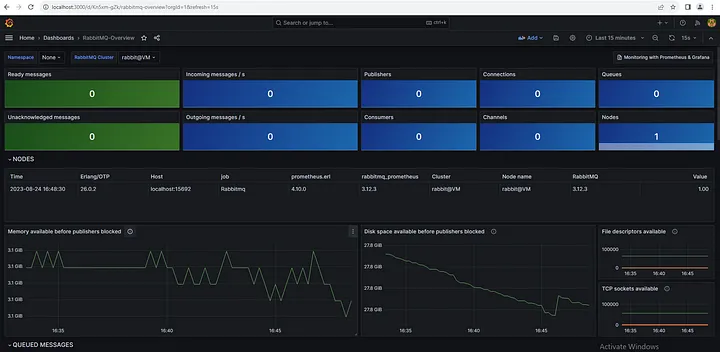
Step 4: Creating and Visualizing Grafana Dashboard (ID 10991)

  • Access the Grafana dashboard at localhost:3000 in your web browser.

  • Click on the “Home” icon in the left sidebar to access the home dashboard.
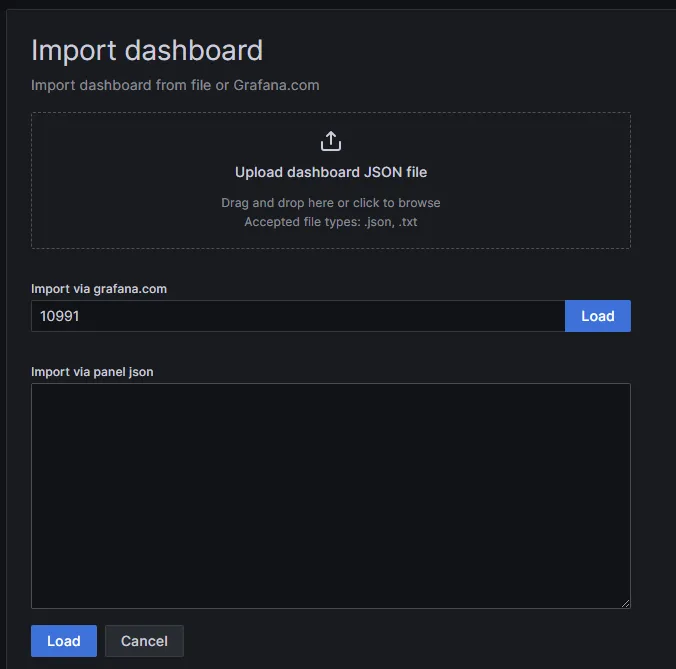
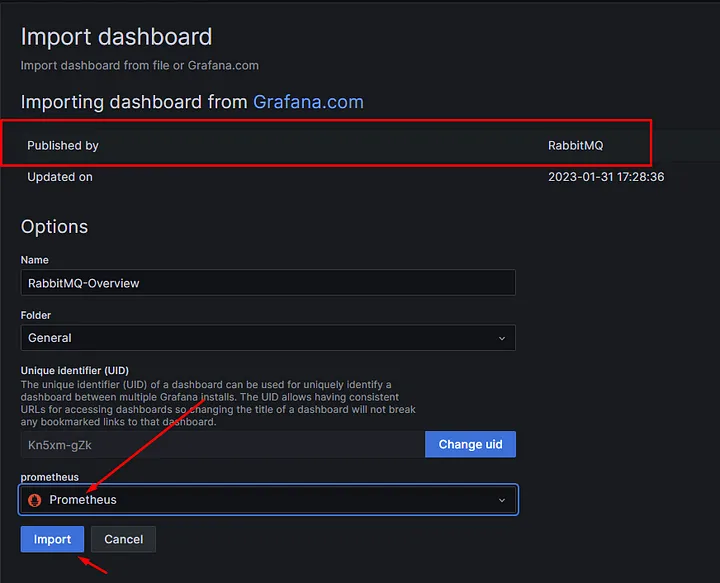
  • Click on the “Import” button in the top menu.

  • Select the option “Import via grafana.com”.
  • Enter the ID 10991 in the appropriate field.

Note: We are installing the theme that RabbitMQ has officially published on its site.


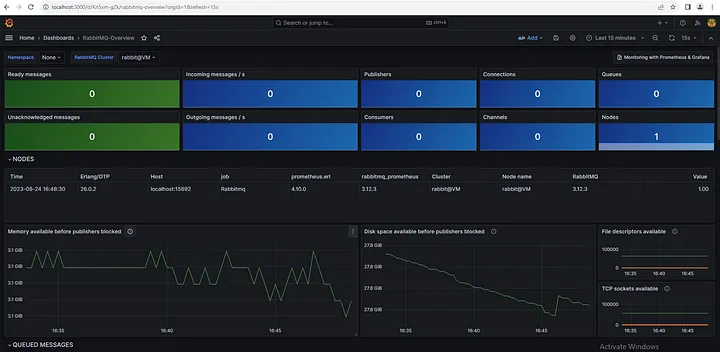
  • The RabbitMQ monitoring dashboard example will be imported.
  • Once imported, you’ll be able to view and interact with the RabbitMQ metrics visualization.


Your questions and feedback are important to me. Every question and feedback you provide helps me improve my service. I’m here to provide you with the best support and address your needs. Thank you…
If you have any questions or details you would like to add, feel free to write me.
Categories
Articles Windows Server

Installation and Configuration of RabbitMQ on Windows Server

RabbitMQ is a popular open-source message queuing software that can be installed on the Windows Server platform. In this guide, you will learn step-by-step how to install RabbitMQ on a Windows Server operating system.

Step 1: Checking Requirements

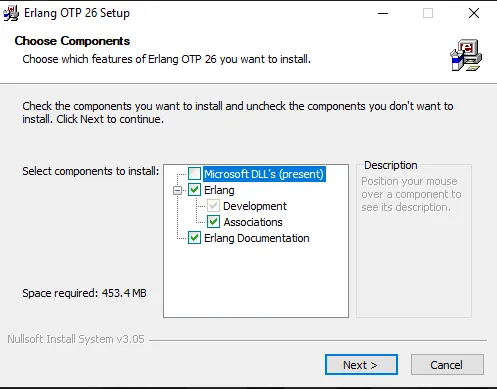
To ensure the smooth operation of RabbitMQ, the runtime of a programming language called Erlang is required. Here is the first step of the installation process:

Step 2: Installing Erlang:

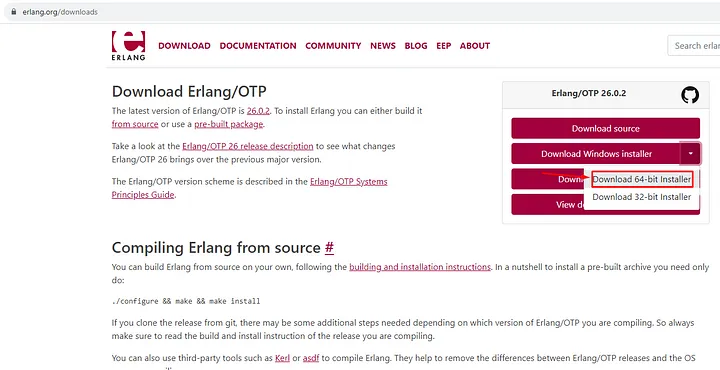
1.Go to the official Erlang website: https://www.erlang.org/downloads

https://www.erlang.org/downloads

2.Download the version suitable for Windows and save it to your computer.

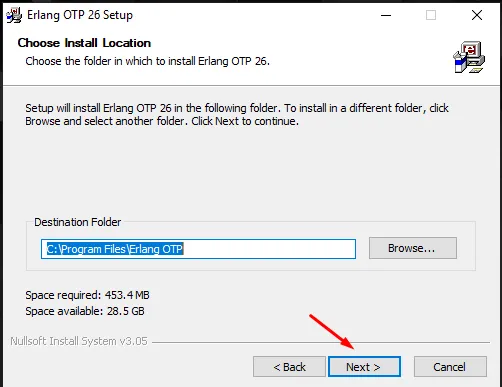
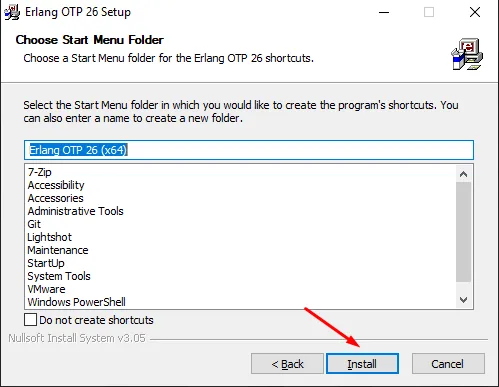
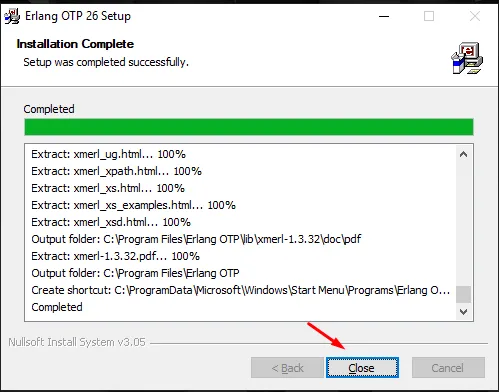
3.Run the downloaded file to install Erlang on your system.

Erlang Setup 01
Erlang Setup 01
Erlang Setup 02
Erlang Setup 02
Erlang Setup 03
Erlang Setup 03
Erlang Setup 04
Erlang Setup 04

Step 3: Installing RabbitMQ:

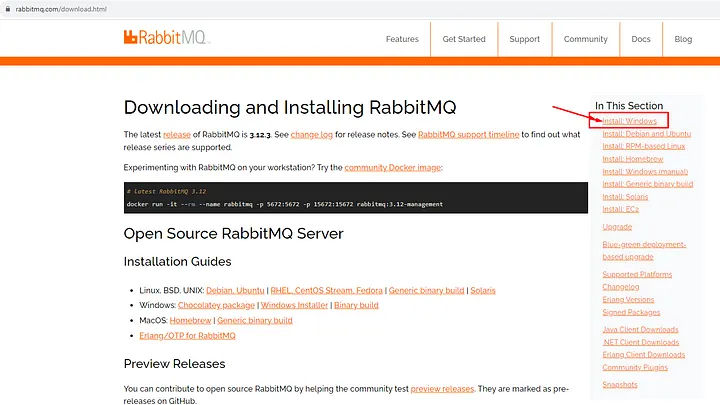
1.Visit the official RabbitMQ website:  https://www.rabbitmq.com/download.html

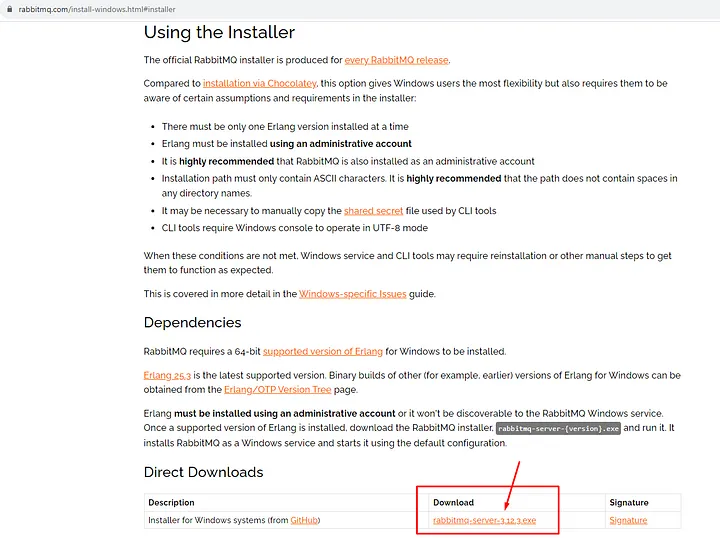
2.Download the “Windows Installer” option suitable for Windows.

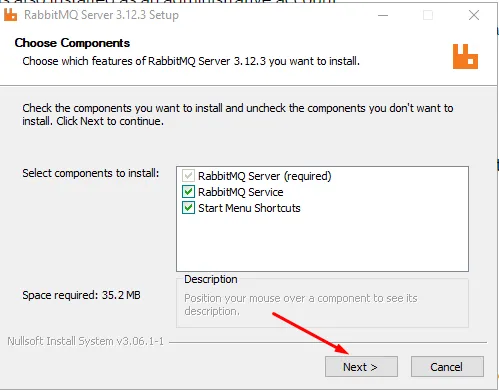
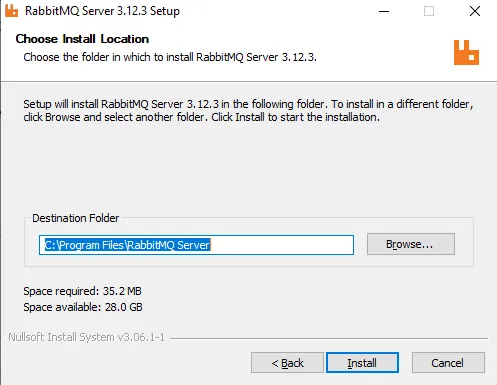
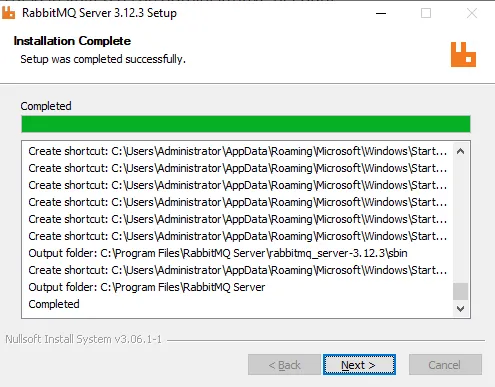
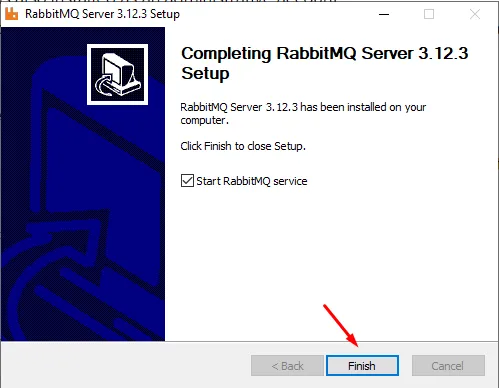
3.Run the downloaded file to install RabbitMQ on your computer.

RabbitMQ Setup 01
RabbitMQ Setup 01
RabbitMQ Setup 02
RabbitMQ Setup 02
RabbitMQ Setup 03
RabbitMQ Setup 03
RabbitMQ Setup 04
RabbitMQ Setup 04

Step 4: Managing Services:

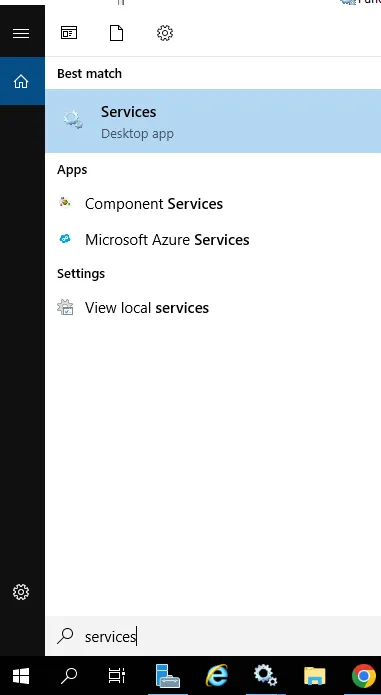
  1. Open the “Services” application from the Start menu.

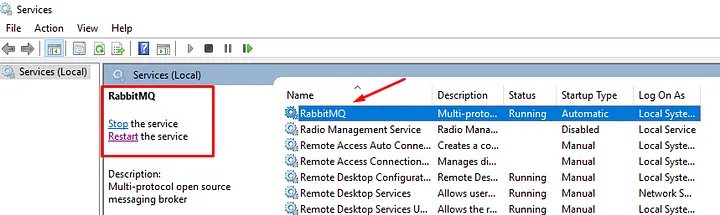
2.Find and stop/start the “RabbitMQ” and “Erlang” services from the list.

Step 5: Accessing the Management Interface (Optional):

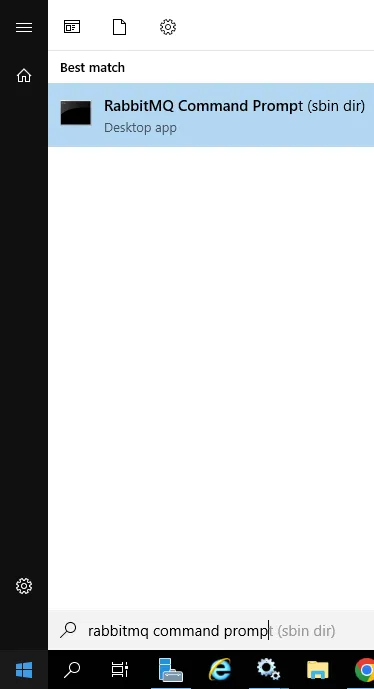
  1. If you want to use the RabbitMQ Management Interface, open the RabbitMQ Command Prompt.
RabbitMQ Komut İstemcisi

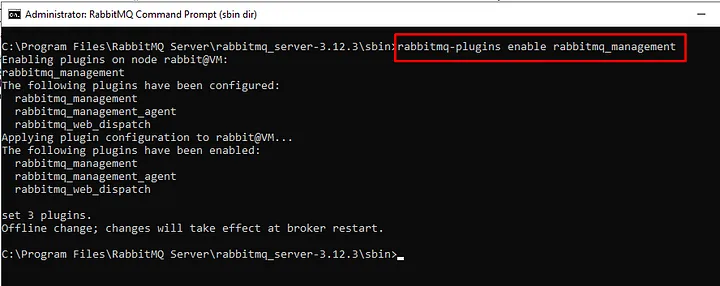
2.Enable the management interface using the following command:

rabbitmq-plugins enable rabbitmq_management
rabbitmq management
rabbitmq management

3.We restart from Services for the changes to take effect.

Step 6: Accessing the Management Interface:

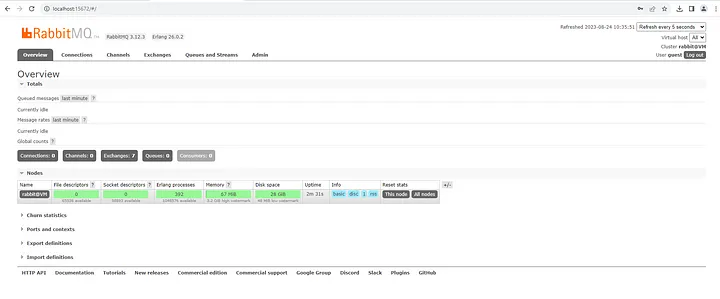
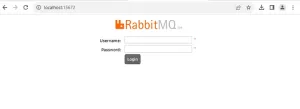
  1. Open your browser and visit the following URL to access the management interface:
http://localhost:15672/

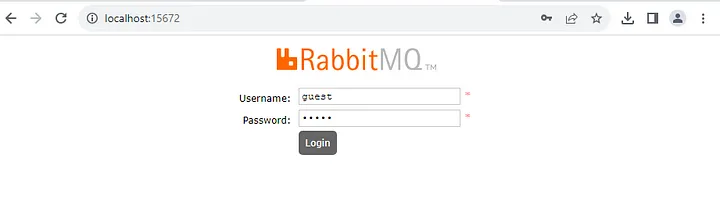
2.The default username and password are set to “guest/guest”. Use these credentials to log in on your first visit.

rabbitmq
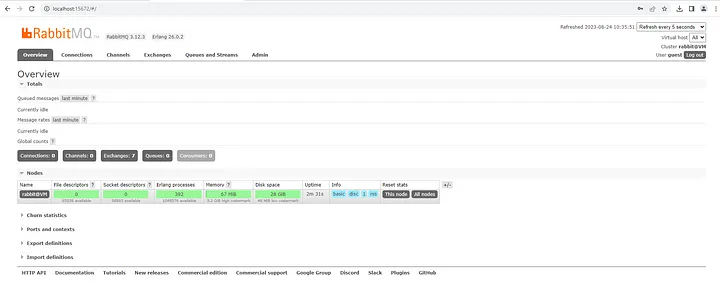
rabbitmq

By following these steps, you can successfully install RabbitMQ on a Windows Server and establish your communication infrastructure.


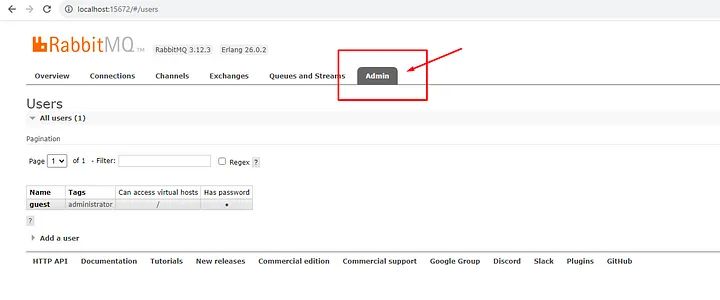
admin
admin

7.Changing the Password

  • After logging into the management interface, click on the “Admin” option from the left menu.

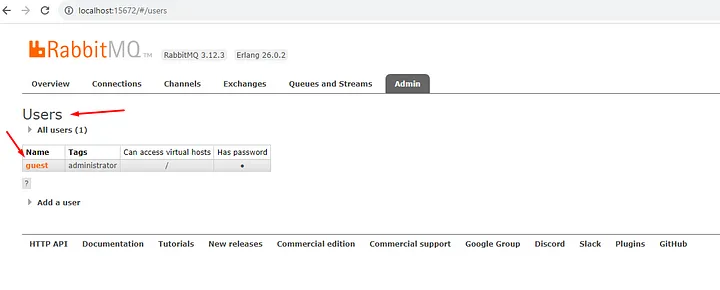
  • Navigate to the “Users” section and find the “guest” user. It should be listed by default.

  • Click on the “guest” user to access the user editing page.
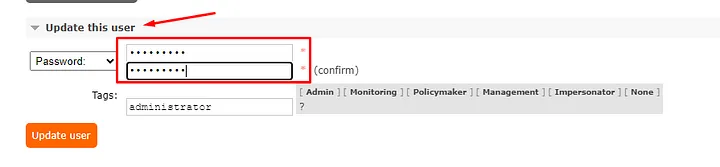
  • In the user editing page, enter a new password in the “Password” field. Enter the same password again in the “Password Confirmation” field.

Using your new password, you can now access the RabbitMQ management interface. Remember that for security reasons, it’s important to use a strong and complex password.


If you have any questions or details you would like to add, feel free to write me.
Categories
Articles Monitoring Windows Server

Part III — Monitoring Process for IIS Servers on Windows Server

Monitoring IIS Servers on Windows Server Using Prometheus, Grafana, and WMI Exporter: Step-by-Step Guide

  1. Prometheus Installation
  • Download Prometheus: Get the latest version of Prometheus from the official website (https://prometheus.io/download/).
  • Extract the downloaded archive and copy the files to a suitable directory.
  • Create a configuration file named prometheus.yml. This file will define the targets to be monitored, such as WMI Exporter.

2. WMI Exporter Installation

  • Download WMI Exporter: Download the WMI Exporter from the GitHub repository.
  • Use the installer found in the “Assets” section to install the exporter.
  • Install the exporter using the MSI installer.
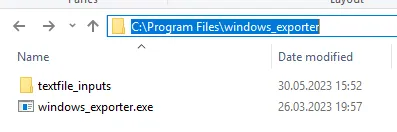
  • The binary will be placed in the directory: C:\Program Files\windows_exporter.
C:\Program Files\windows_exporter
  • If there’s a running process/task named “windows_exporter,” terminate it, as we will need to manually start the exporter with additional flags.
  • To fetch IIS Server statistics, manually run the exporter using the following command:
"C:\Program Files\windows_exporter\windows_exporter.exe" --collectors.enabled="cpu,cs,iis,logical_disk,net,os,service,system,textfile"
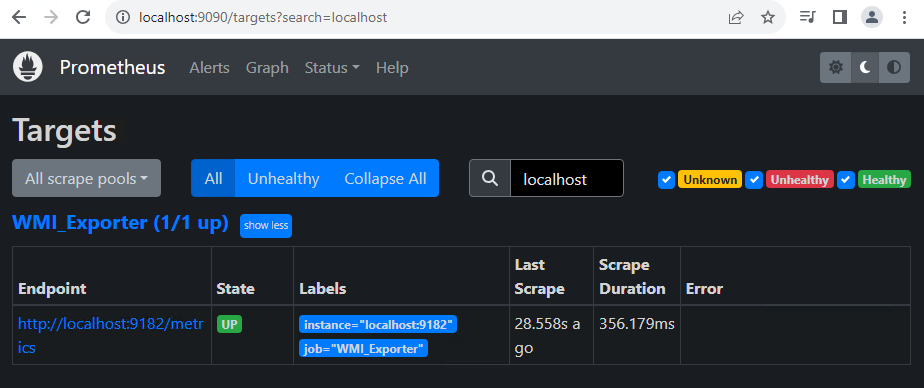
  • Access http://localhost:9182/metrics in your browser to view the available metrics.
  • To make the changes persistent, add the following settings to the registry:
"C:\Program Files\windows_exporter\windows_exporter.exe" --collectors.enabled="cpu,cs,iis,logical_disk,net,os,service,system,textfile" --log.format logger:eventlog?name=windows_exporter

In our previous article, you can find information on how to perform monitoring on a Windows server


3. Configuring Prometheus with WMI Exporter

  • Open your prometheus.yml file and add WMI Exporter as a target like this:
scrape_configs:
- job_name: 'wmi'
  static_configs:
    - targets: ['localhost:9182'] # Varsayılan WMI Exporter portu

4. Grafana Installation and Configuration

  • Download Grafana: Get the latest version of Grafana from the official website (https://grafana.com/grafana/download).
  • Extract the downloaded archive and copy the files to a suitable directory.
  • Start Grafana: Launch Grafana using the command line (e.g., grafana-server.exe).
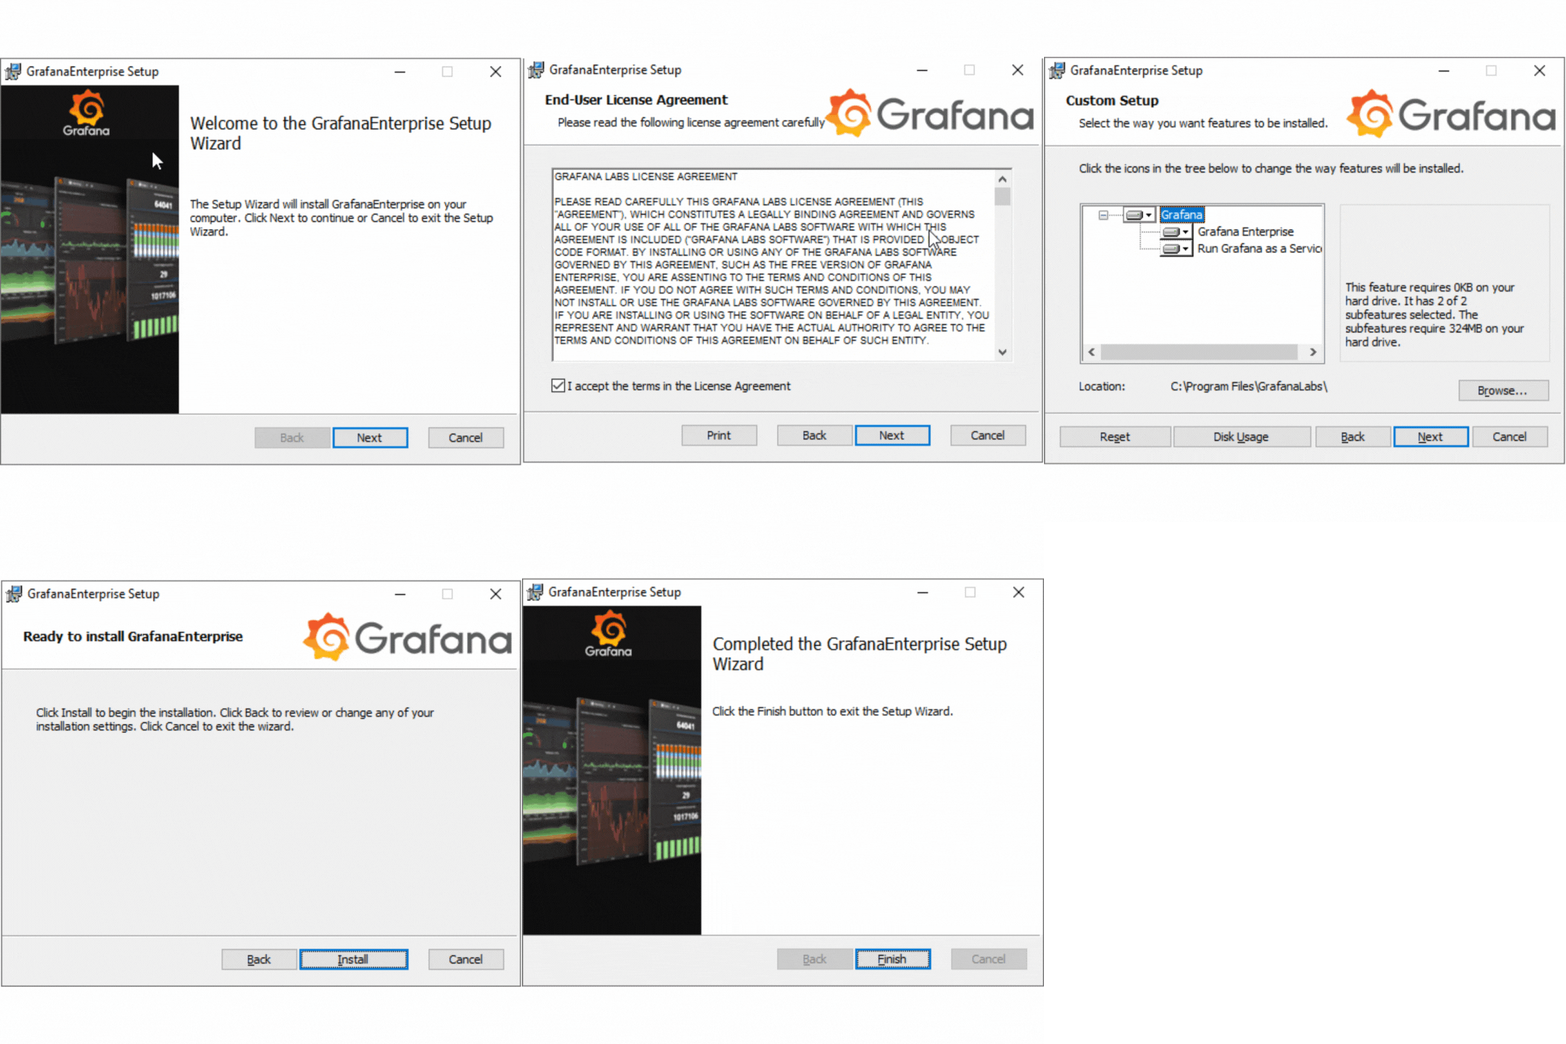
Grafana setup
Grafana setup

5. Creating a Dashboard on Grafana

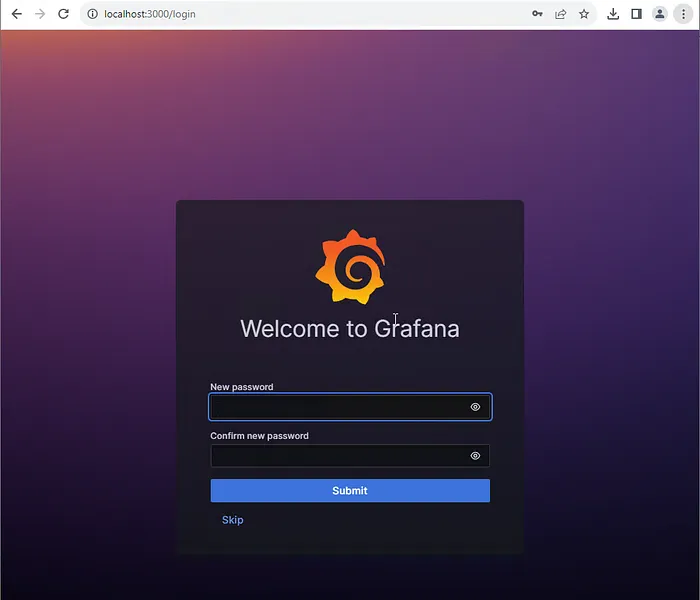
  • Access the Grafana web interface by visiting http://localhost:3000 in your browser (default port 3000).
  • Log in with the default credentials (admin/admin).
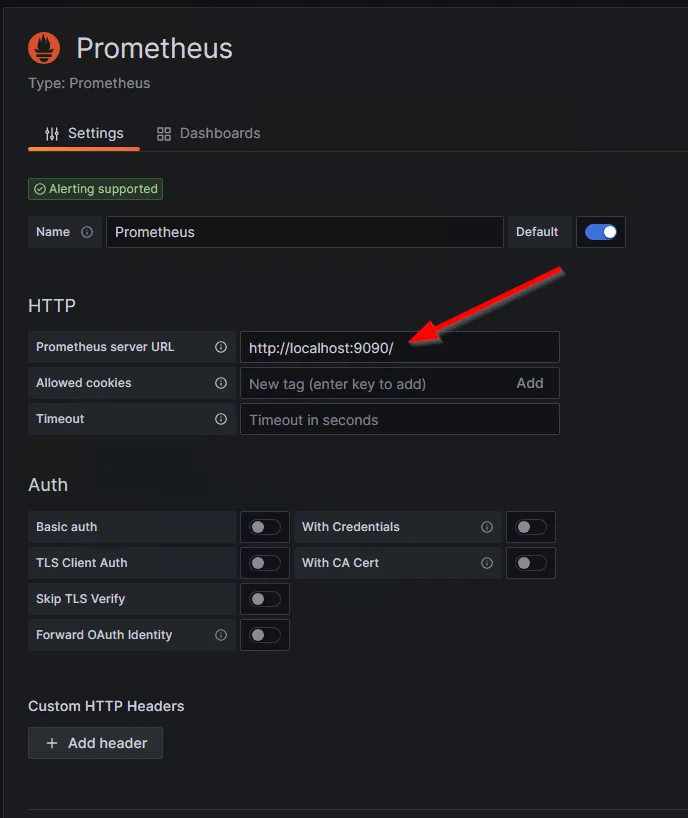
  • Go to the “Configuration” menu, select “Data Sources,” and add a new data source. Choose “Prometheus” and provide the address of your Prometheus server (e.g., http://localhost:9090).
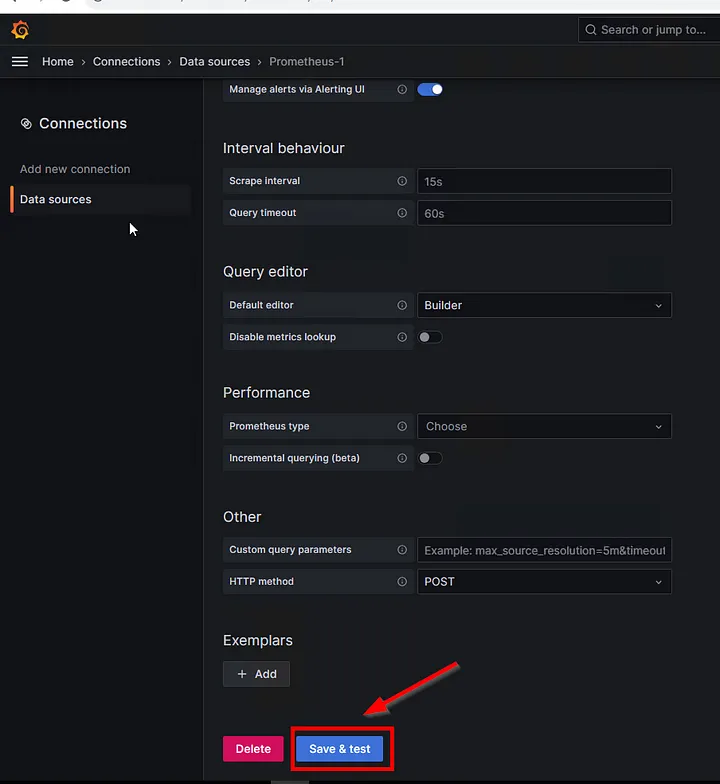
  • Click “Save & Test” to add the data source.
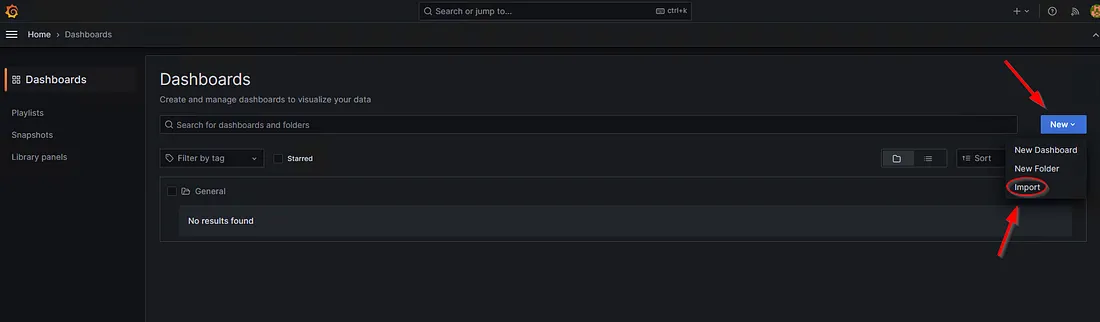
  • Navigate to the “Dashboard” section, click “New,” and select “Import.”

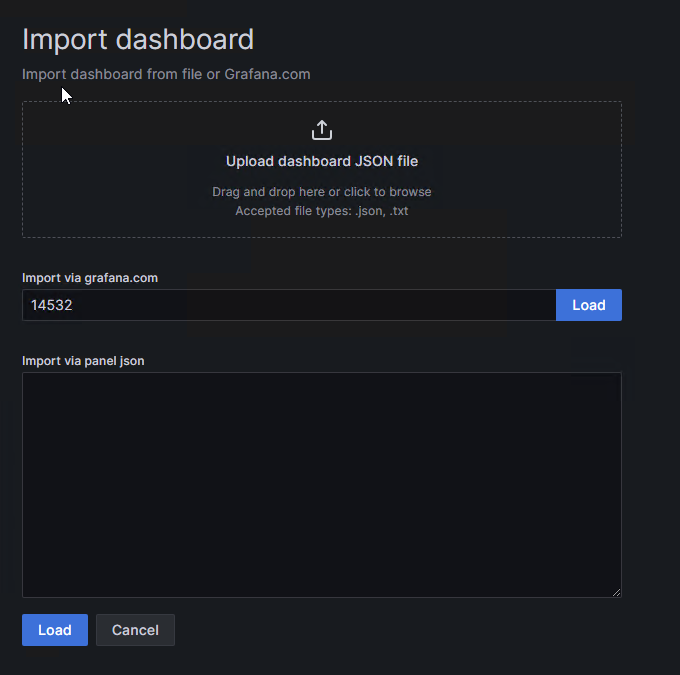
  • Search for a Dashboard ID starting with a specific number on grafana.com, or directly import a JSON file.

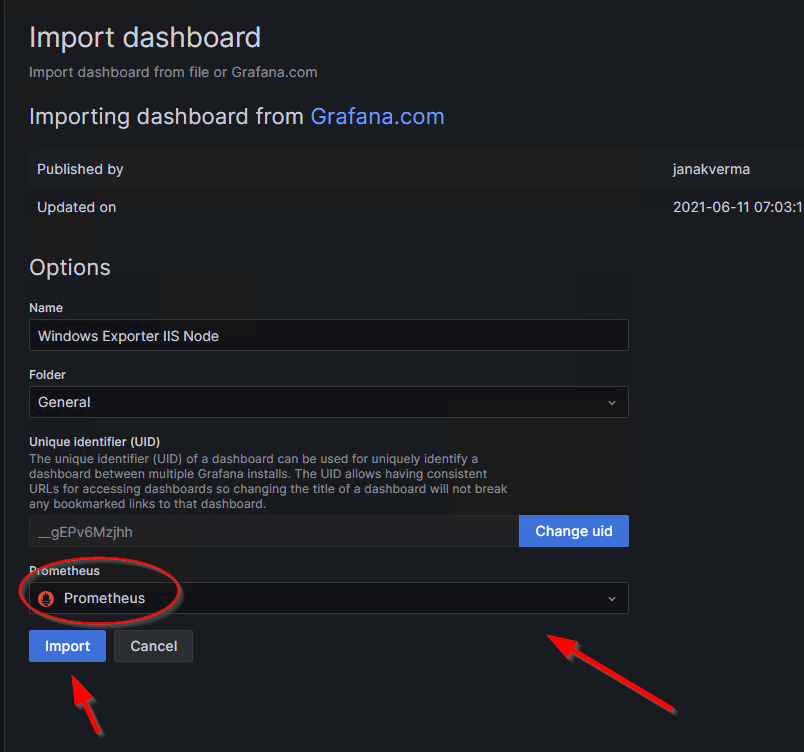
IIS Dashboard ID:14532

6. Observing the Dashboard

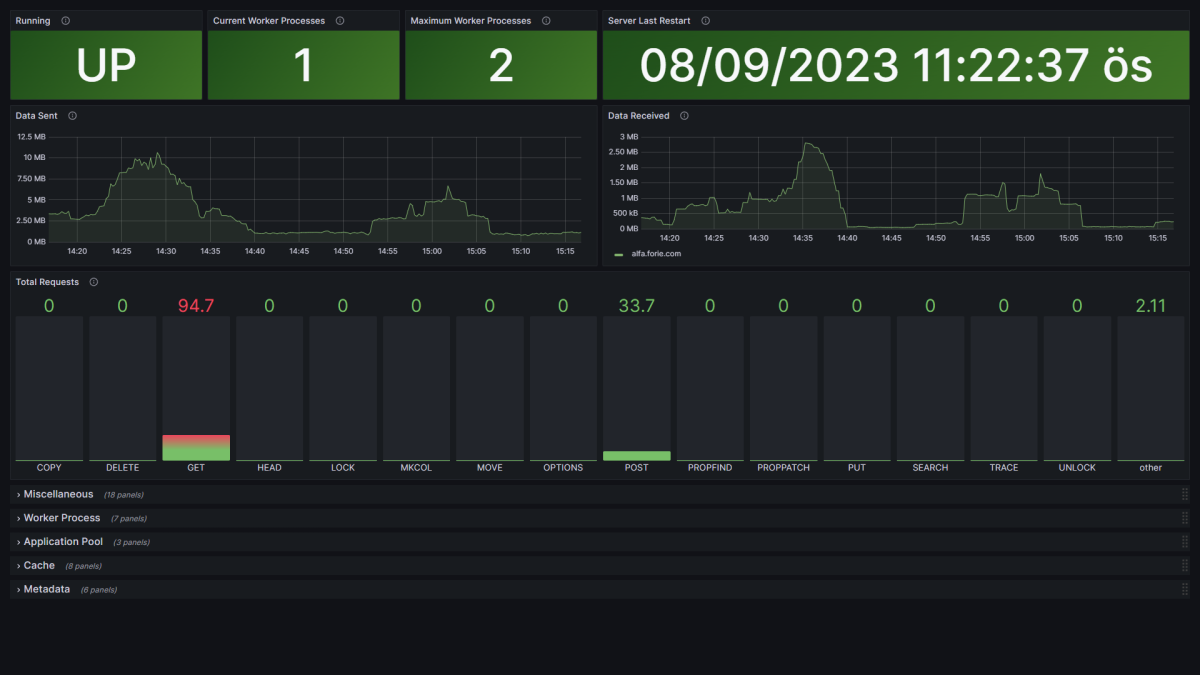
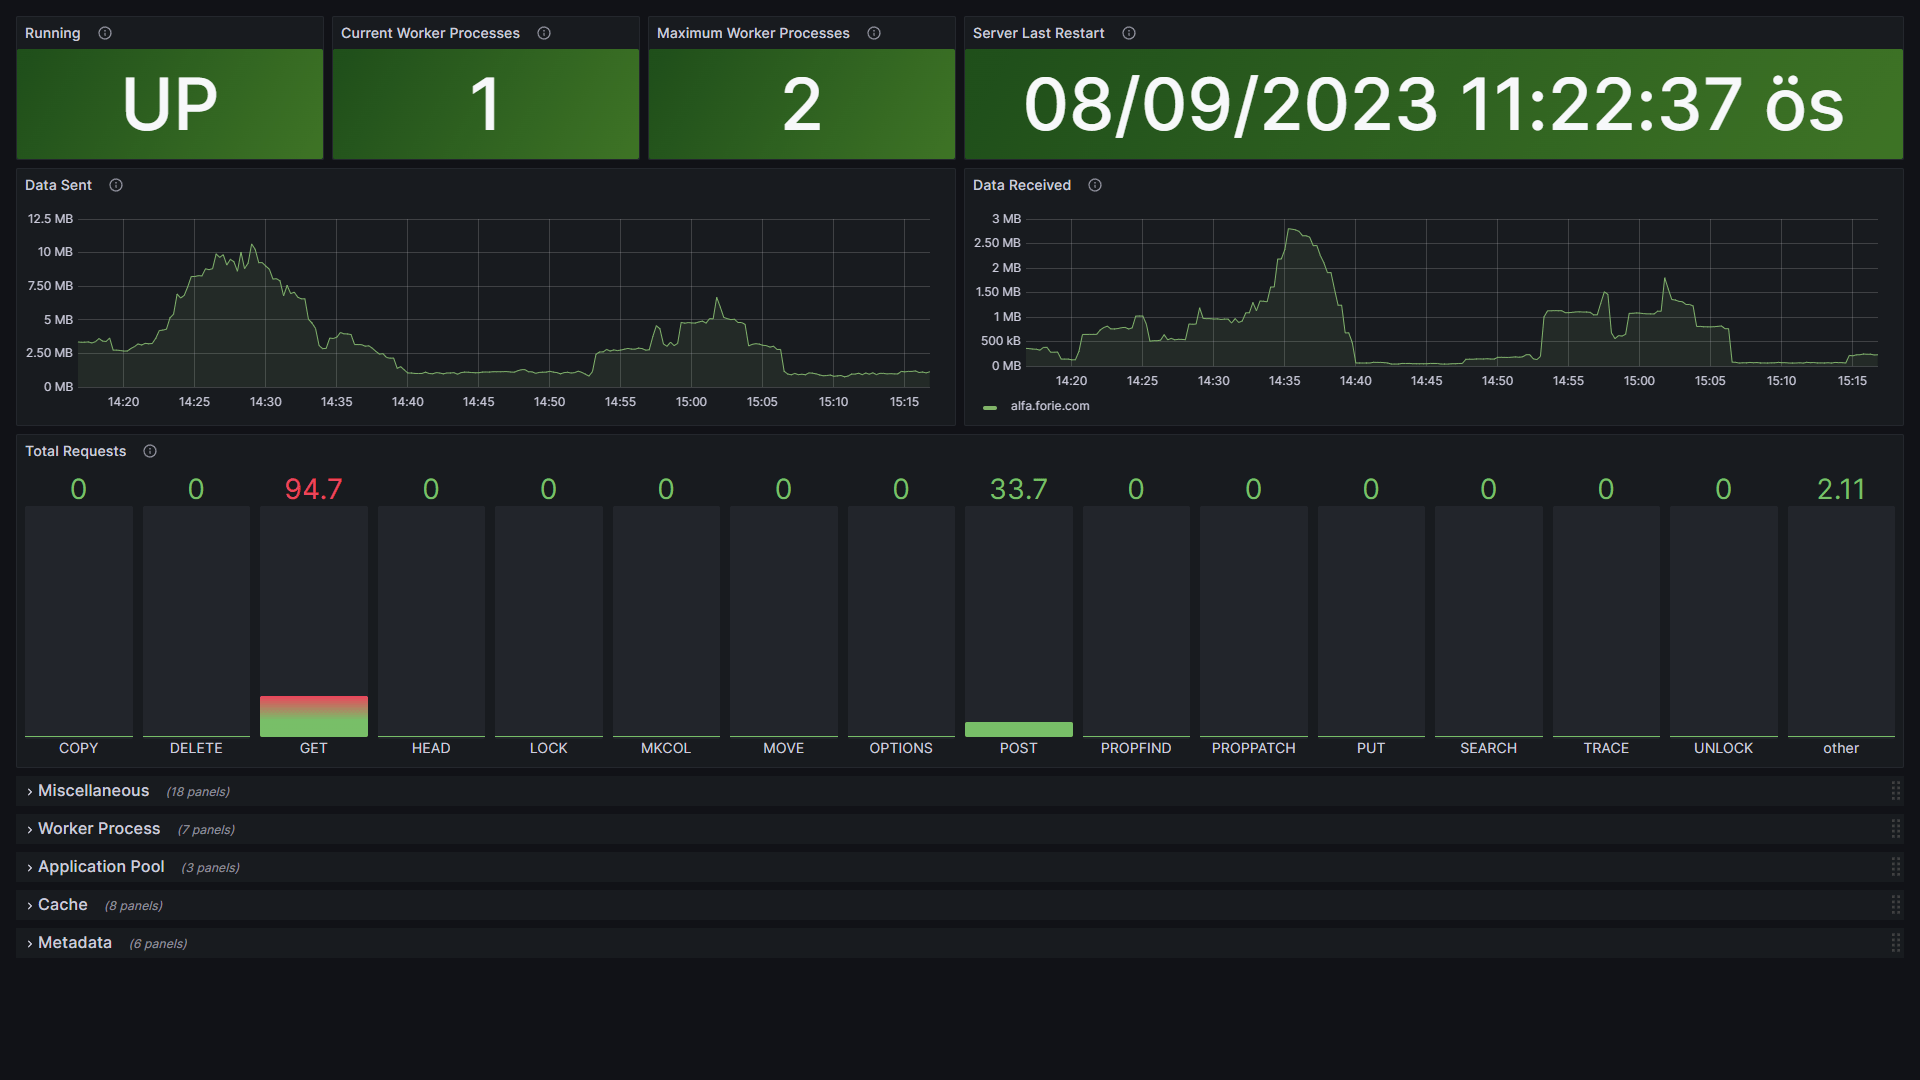
  • You can observe IIS server monitoring data on the created dashboard. Grafana will help visualize the metrics obtained from Prometheus.
IIS Monitoring
IIS Monitoring

If you have any questions or details you would like to add, feel free to write me.