
Let’s start by outlining the general steps for setting up a monitoring system using Prometheus, Grafana, and WMI Exporter on Windows Server. Keep in mind that technologies and versions may change over time, so it’s important to refer to the most up-to-date documentation and resources.
- Define Requirements:
- Determine which version of Windows Server you will use.
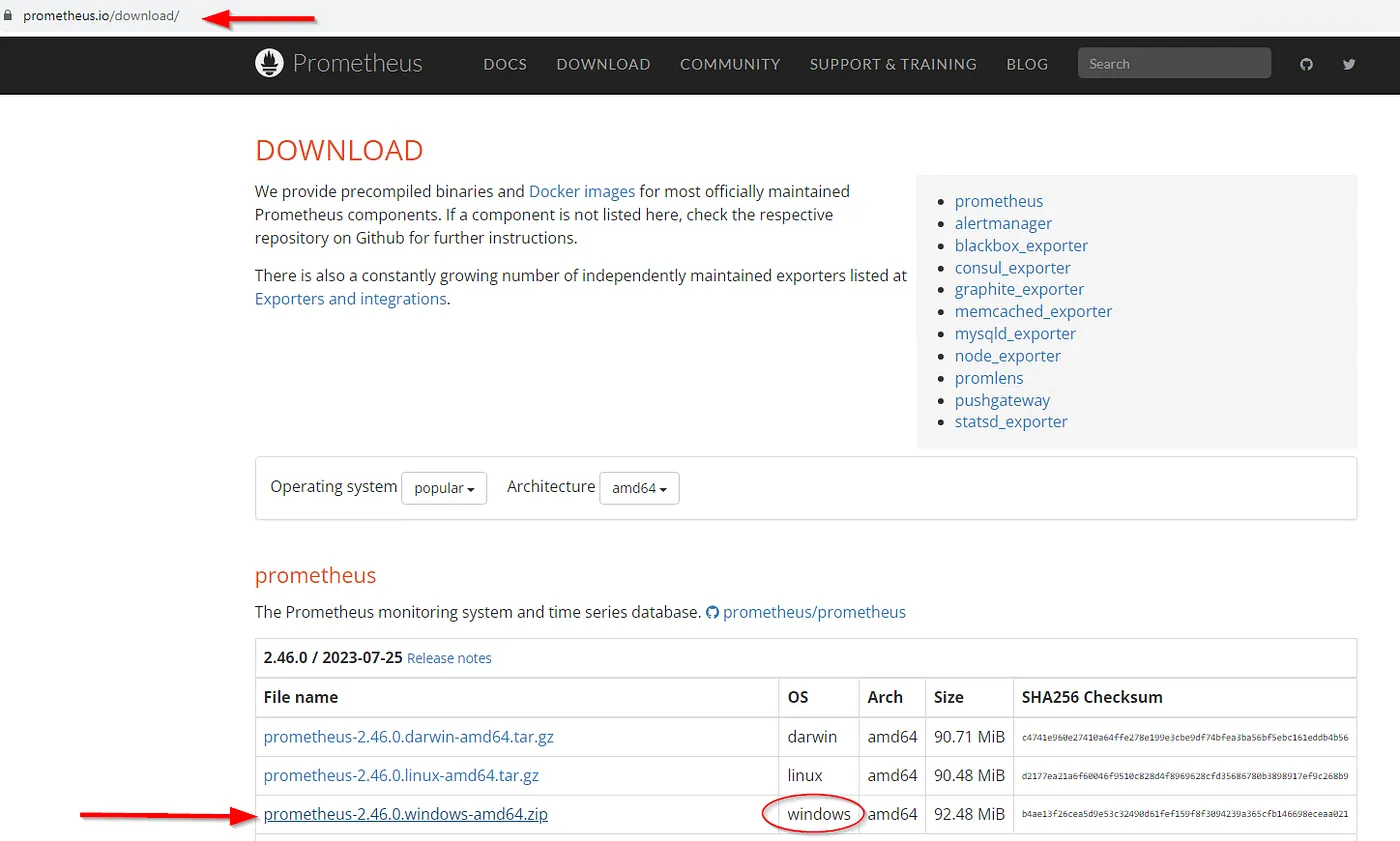
- Download the latest versions of Prometheus and Grafana.
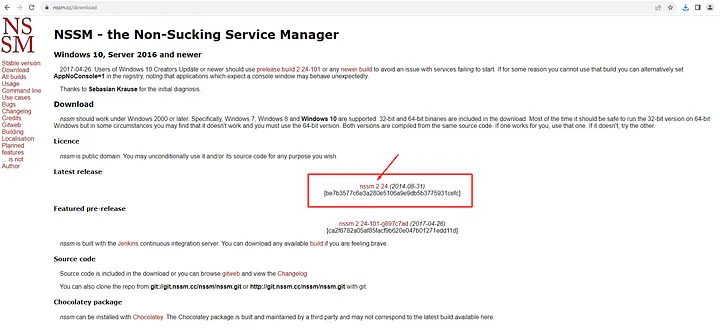
- Download the WMI Exporter.
2.Prometheus Installation:
- Download and extract Prometheus.
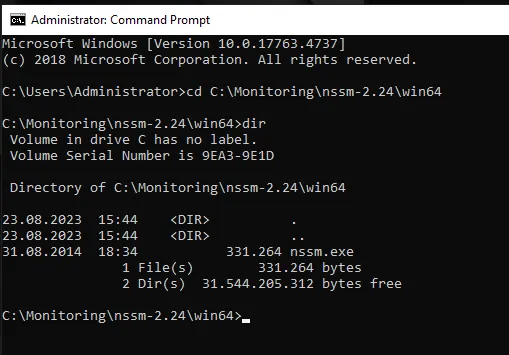
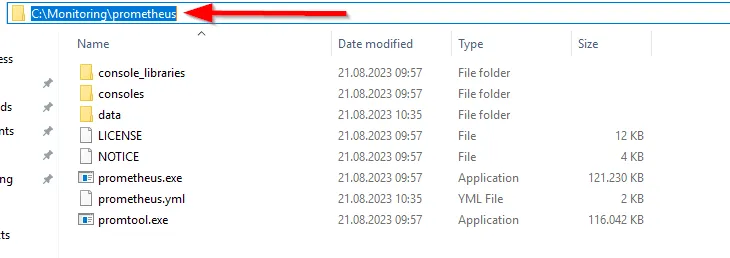
- Create a directory, e.g., ‘C:\Monitoring\prometheus’, and extract the downloaded .zip file here.
- Create a configuration file named ‘prometheus.yml’.
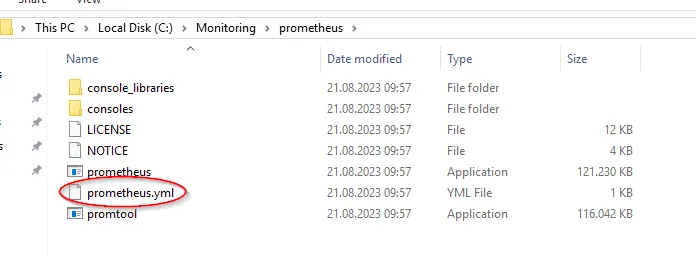
- In ‘prometheus.yml’, define your targets (your Windows Servers) and the metrics you want to monitor. Here, we’re defining ‘localhost:9182’ to collect metrics from our existing server. We’ll install the WMI Exporter in later steps.
- Example ‘prometheus.yml’ configuration:
# Global config
global:
scrape_interval: 15s
evaluation_interval: 15s

scrape_configs:
- job_name: "prometheus"
static_configs:
- targets: ["localhost:9090"]

- job_name: "WMI_Exporter"
static_configs: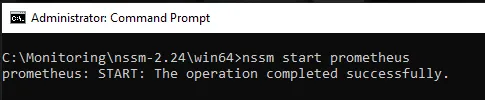
- targets: ["localhost:9182"]- Start Prometheus by running the following command in the relevant directory:
prometheus.exe --config.file=prometheus.yml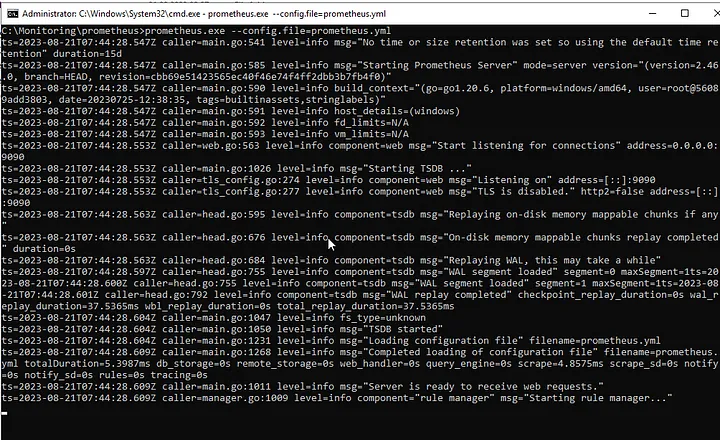
- By default, Prometheus’ web interface will be available at http://localhost:9090.
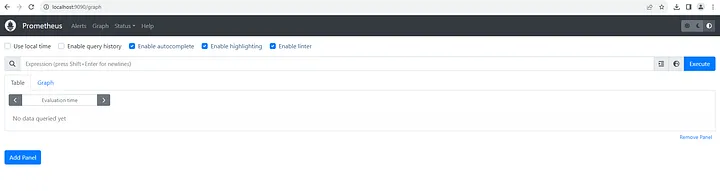
- You can access the Prometheus interface by opening this address in a web browser.
3.WMI Exporter Installation:
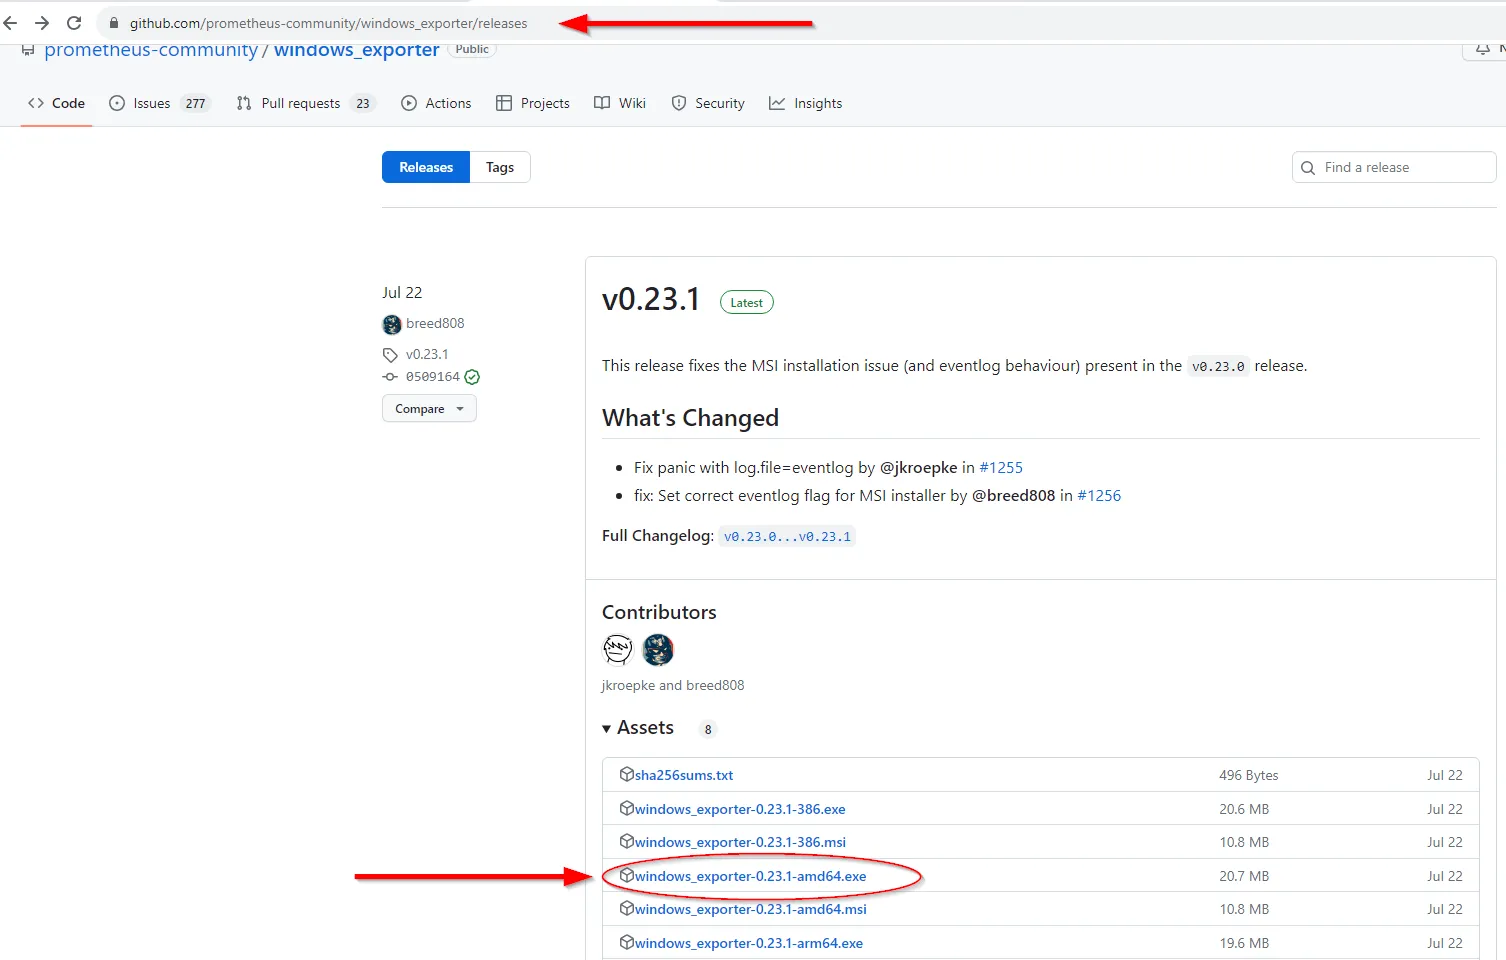
- Download and extract the WMI Exporter.
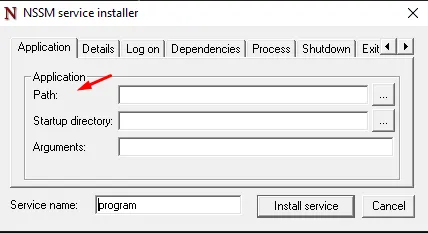
- Run the ‘wmi_exporter.exe’ file. (You might encounter an unknown publisher warning; proceed by selecting “Run” anyway.)
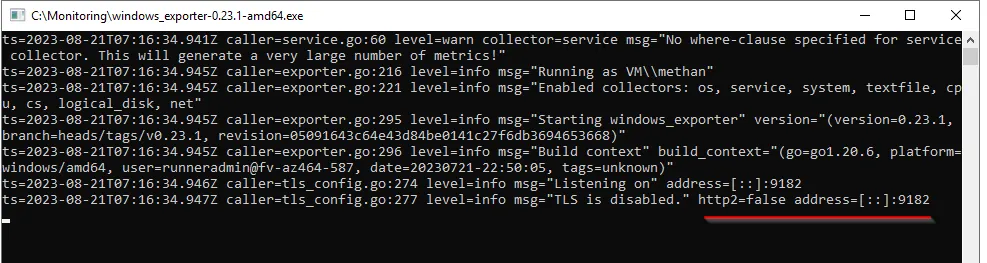
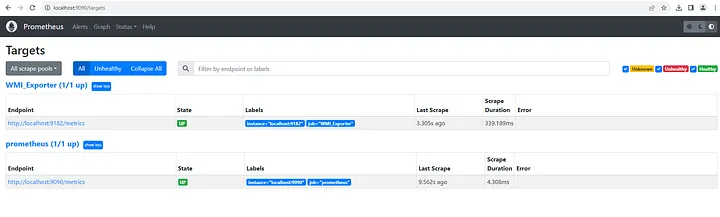
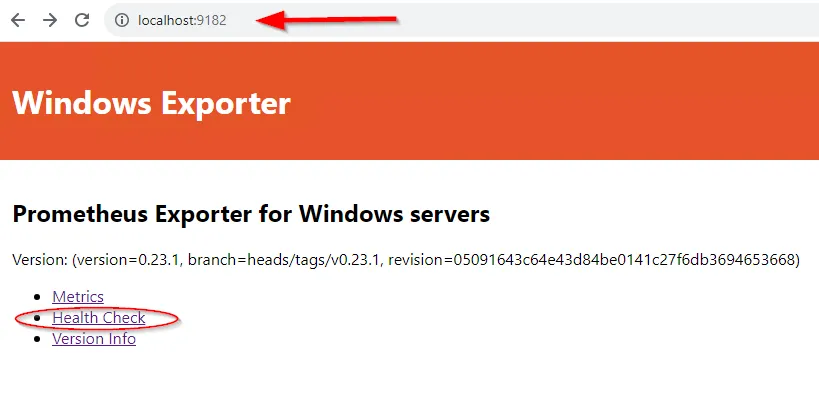
- To verify that ‘wmi_exporter.exe’ is running, open your browser and navigate to: http://localhost:9182.
- Configure the WMI Exporter. This configuration determines which WMI queries to run and which metrics to collect.
4. Grafana Installation:
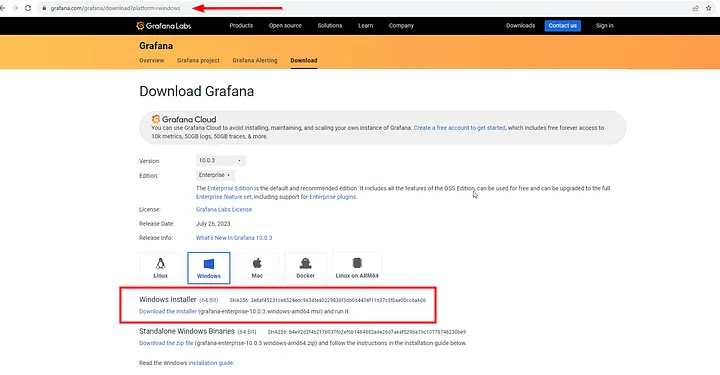
- Download and install Grafana.
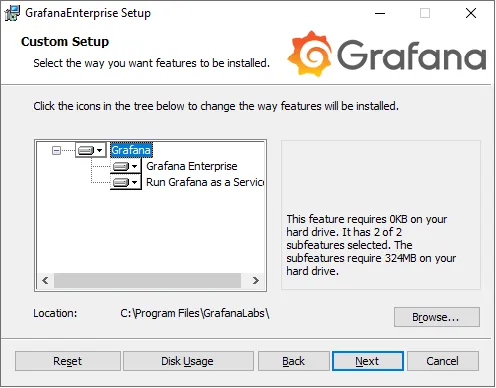
Run the downloaded ‘.exe’ file and follow the installation steps:
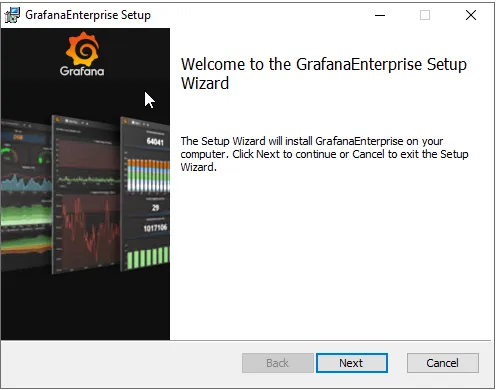
Proceed through the setup by clicking ‘Next’.
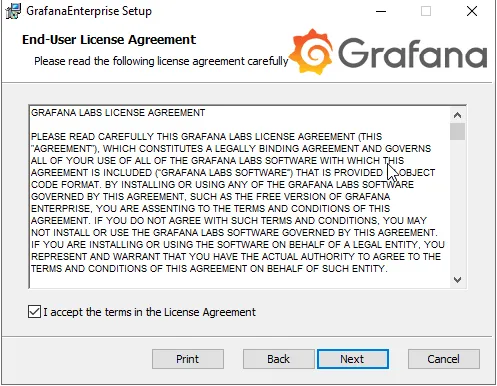
Accept the license agreement and continue by clicking ‘Next’.
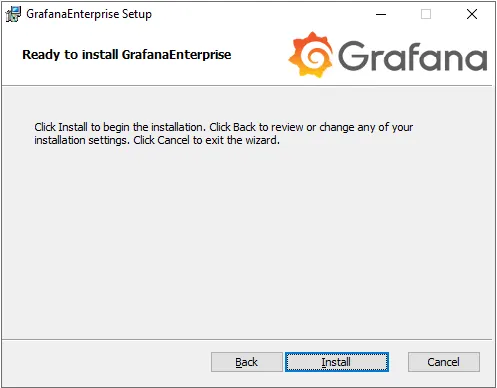
Complete the installation by clicking ‘Install’.
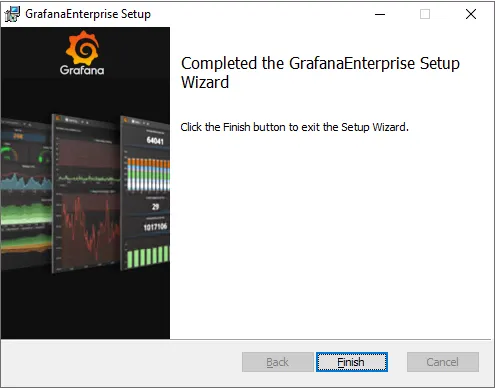
Finish the installation by clicking ‘Finish’.
- Access the Grafana interface using a web browser at ‘localhost:3000’.
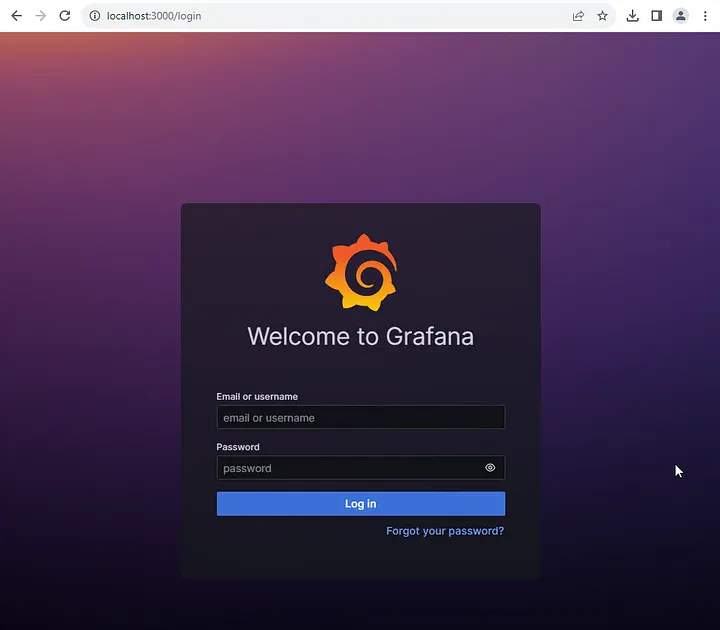
- During the initial login, use the default credentials: Username: ‘admin’, Password: (set a password of your choice).
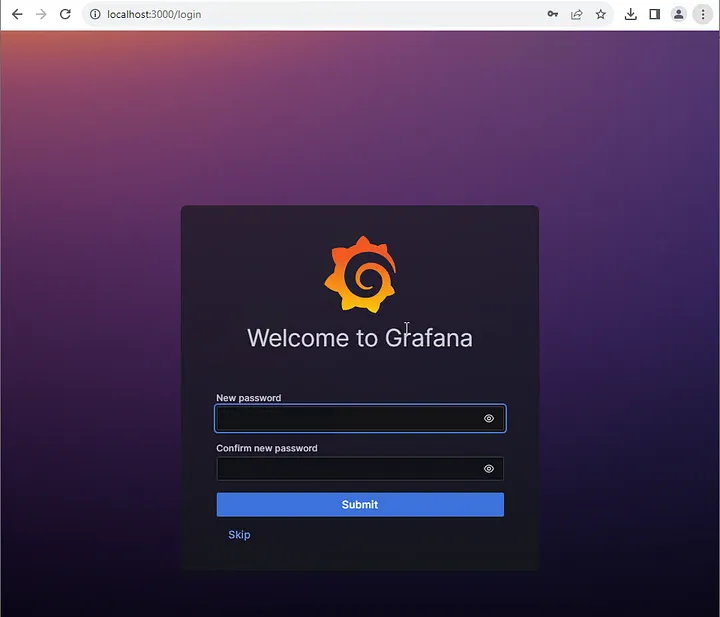
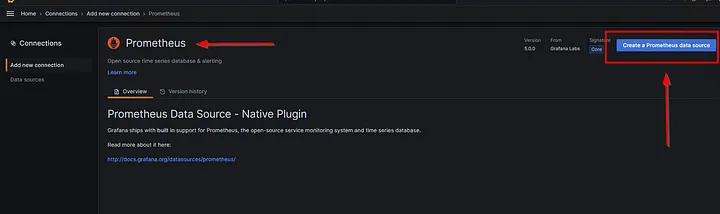
change default password Log in to Grafana, and add a data source. Prometheus will be the database source to transfer data to Grafana.
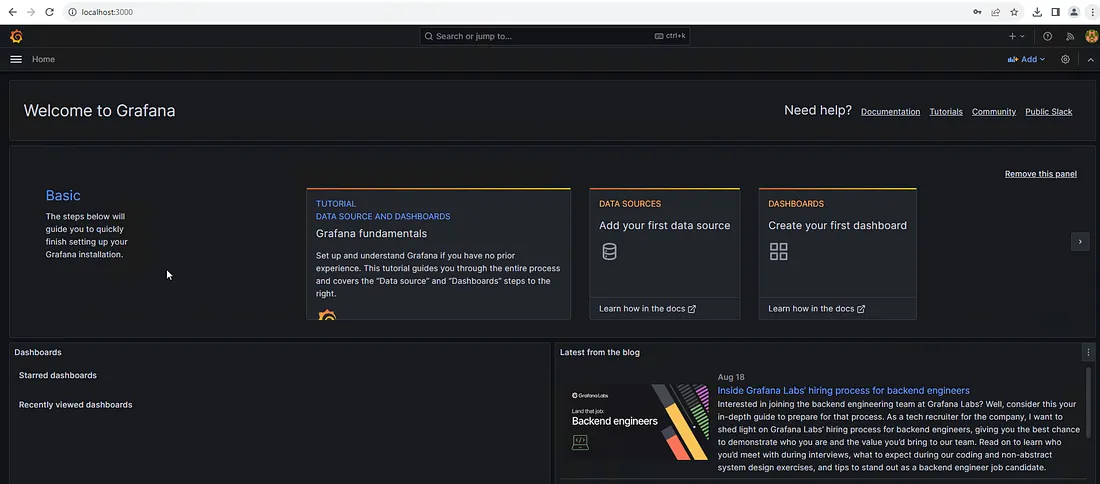
- Log in to Grafana, and add a data source. Prometheus will be the database source to transfer data to Grafana.
- Log in to Grafana, and add a data source. Prometheus will be the database source to transfer data to Grafana.
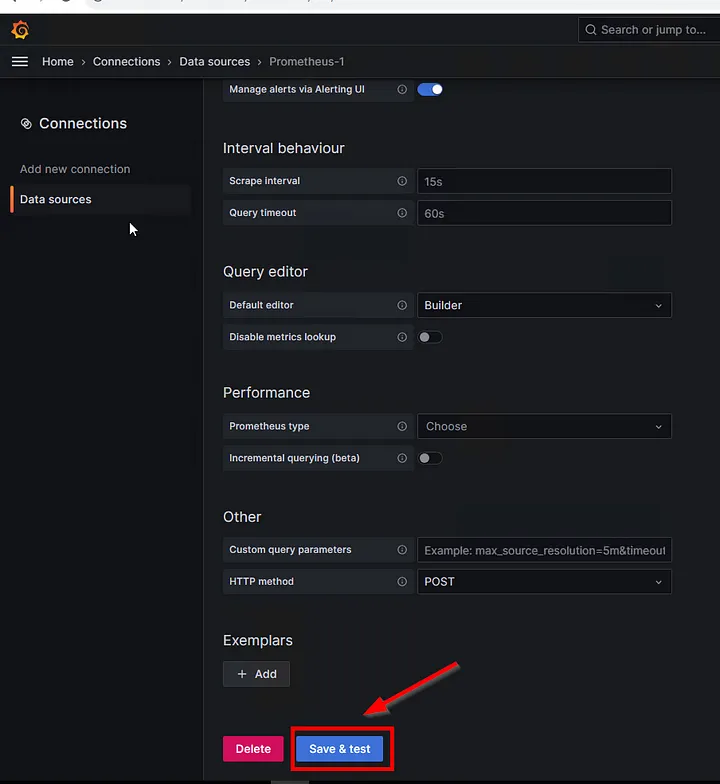
- Enter Prometheus server URL: http://localhost:9090/ and click ‘Save & Test’.
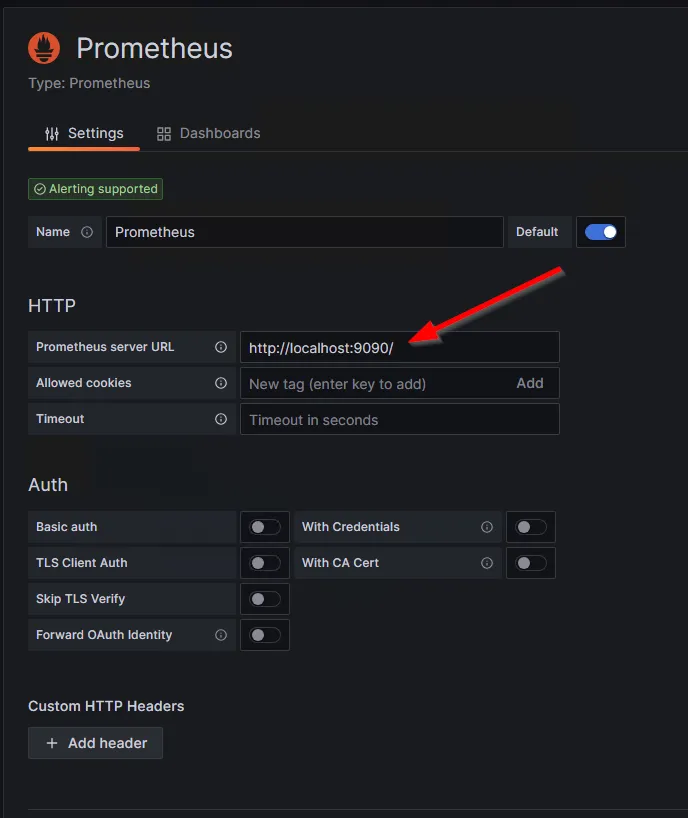
- ‘Save & test’ diyerek ekleme işlemini bitiriyoruz.
To summarize the steps:
- We completed the setup and configuration of Prometheus to create a database to store metrics received from the WMI Exporter.
- We installed the WMI Exporter, enabling us to collect metrics from our Windows server.
- Grafana installation was completed to visualize the metrics obtained from Prometheus.
For visualization, proceed to the Grafana website.
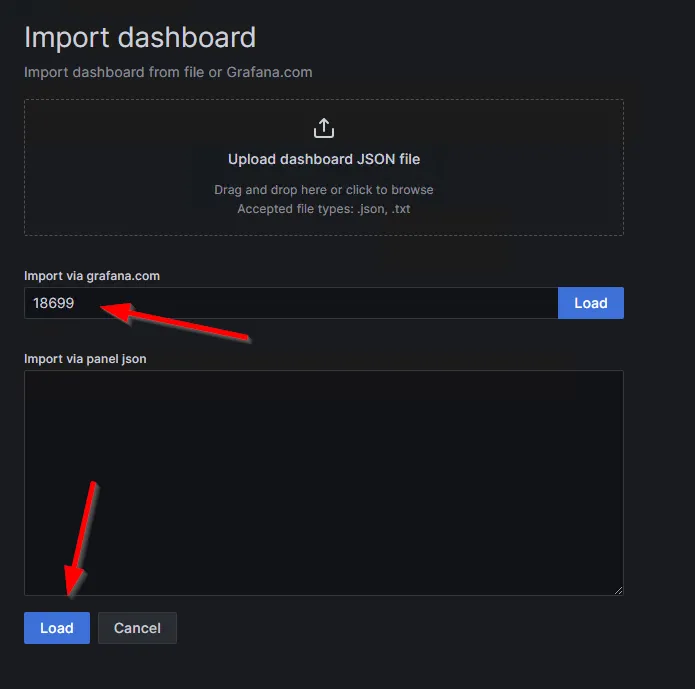
- Select a suitable theme, navigate to ‘Dashboards’, click ‘New/Import’, and import the desired dashboard using its ID.
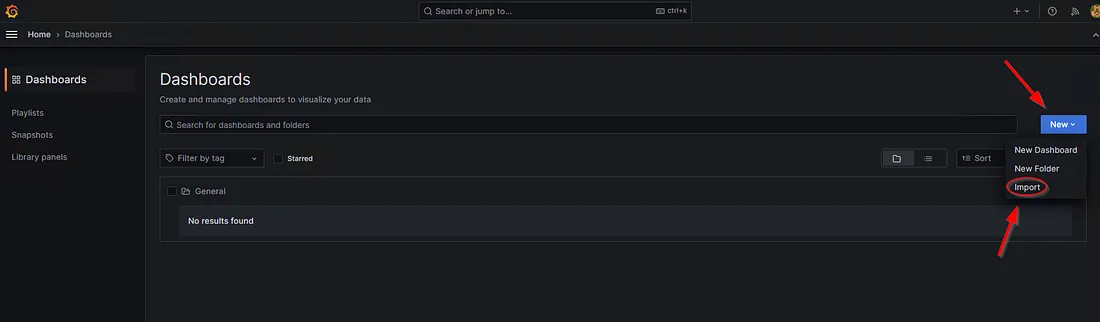
- On the screen that comes up, we enter the theme ID in the ‘Import via grafana.com’ section and select ‘Load’.
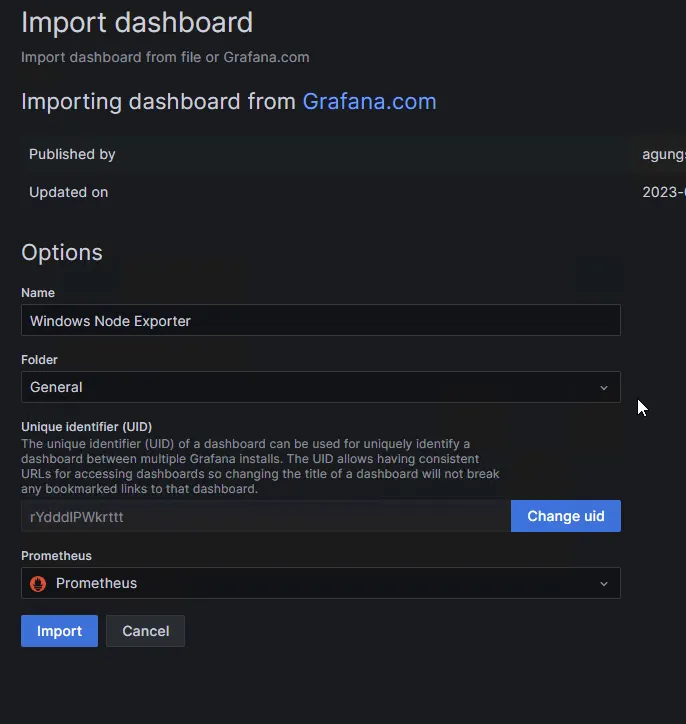
- The database ‘Prometheus’ is selected and the ‘import’ option is selected.
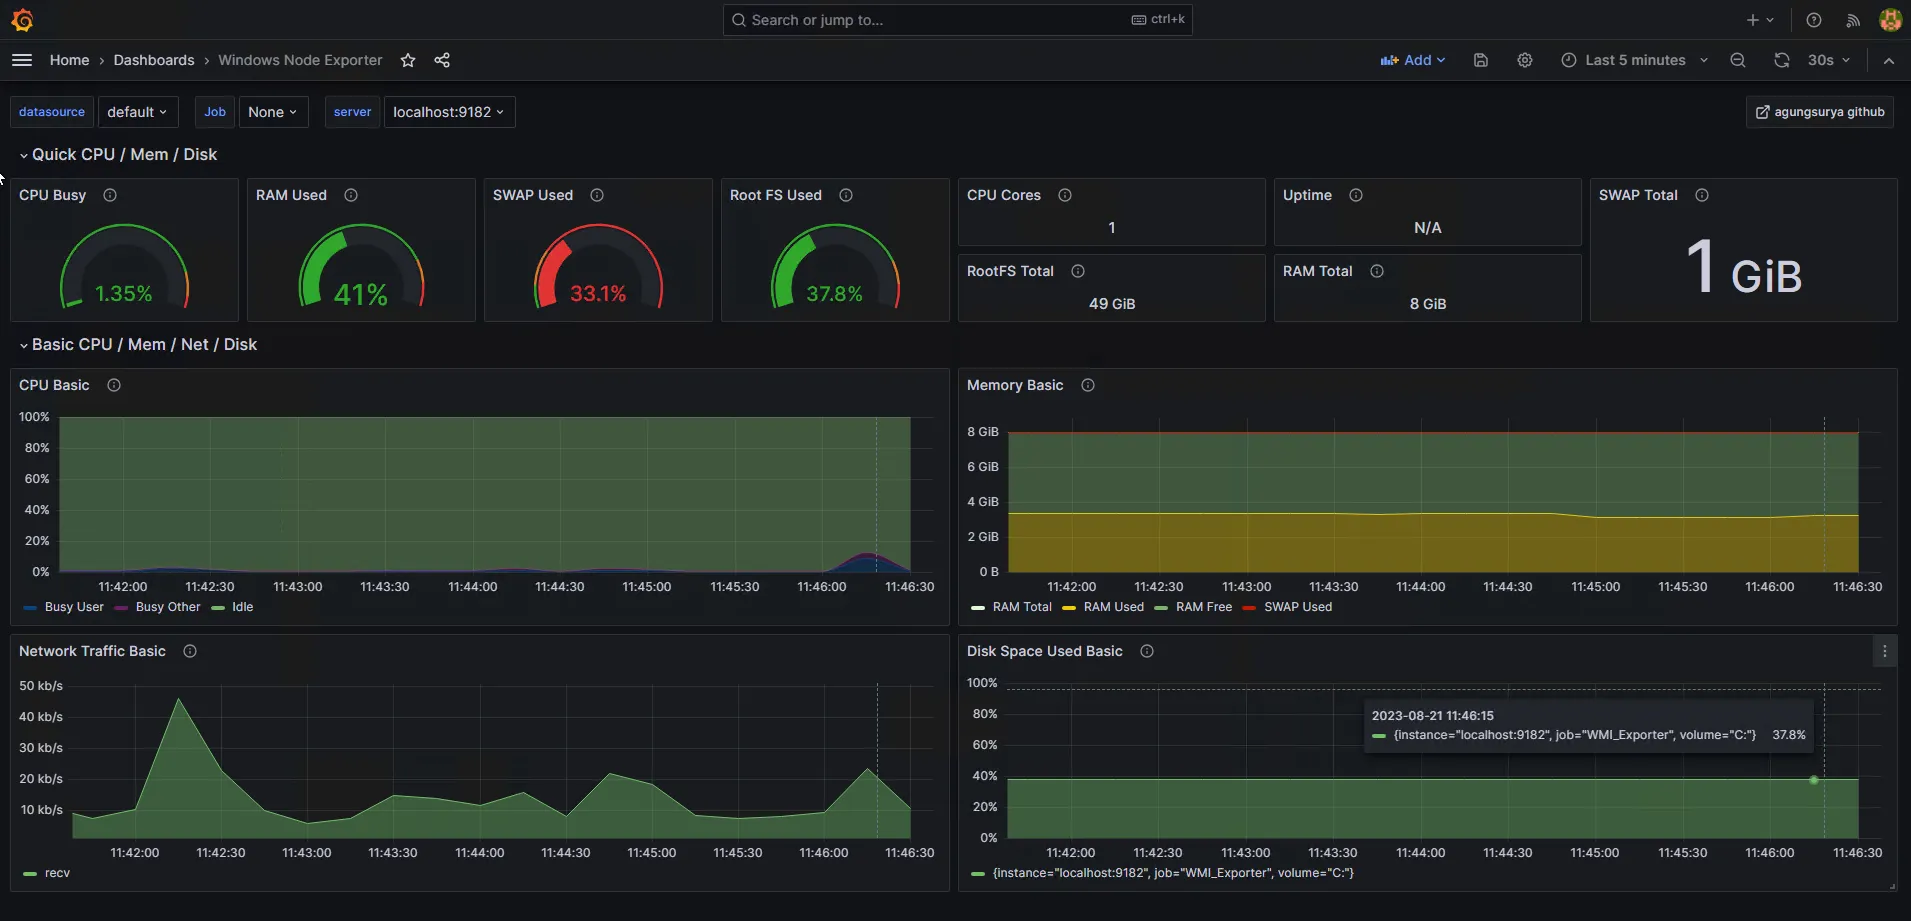
- As a result, we have completed the monitoring process;
Congratulations on following through these steps patiently. Thank you!