
Monitoring IIS Servers on Windows Server Using Prometheus, Grafana, and WMI Exporter: Step-by-Step Guide
- Prometheus Installation
- Download Prometheus: Get the latest version of Prometheus from the official website (https://prometheus.io/download/).
- Extract the downloaded archive and copy the files to a suitable directory.
- Create a configuration file named
prometheus.yml. This file will define the targets to be monitored, such as WMI Exporter.
2. WMI Exporter Installation
- Download WMI Exporter: Download the WMI Exporter from the GitHub repository.
- Use the installer found in the “Assets” section to install the exporter.
- Install the exporter using the MSI installer.
- The binary will be placed in the directory:
C:\Program Files\windows_exporter.
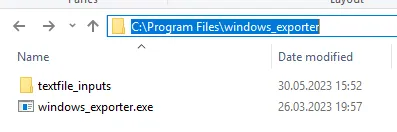
- If there’s a running process/task named “windows_exporter,” terminate it, as we will need to manually start the exporter with additional flags.
- To fetch IIS Server statistics, manually run the exporter using the following command:
"C:\Program Files\windows_exporter\windows_exporter.exe" --collectors.enabled="cpu,cs,iis,logical_disk,net,os,service,system,textfile"
- Access http://localhost:9182/metrics in your browser to view the available metrics.
- To make the changes persistent, add the following settings to the registry:
"C:\Program Files\windows_exporter\windows_exporter.exe" --collectors.enabled="cpu,cs,iis,logical_disk,net,os,service,system,textfile" --log.format logger:eventlog?name=windows_exporterIn our previous article, you can find information on how to perform monitoring on a Windows server
3. Configuring Prometheus with WMI Exporter
- Open your
prometheus.ymlfile and add WMI Exporter as a target like this:
scrape_configs:
- job_name: 'wmi'
  static_configs:
    - targets: ['localhost:9182'] # Varsayılan WMI Exporter portu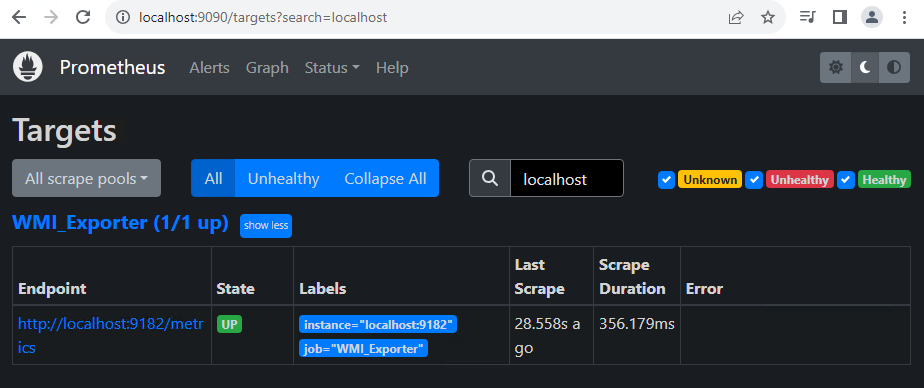
4. Grafana Installation and Configuration
- Download Grafana: Get the latest version of Grafana from the official website (https://grafana.com/grafana/download).
- Extract the downloaded archive and copy the files to a suitable directory.
- Start Grafana: Launch Grafana using the command line (e.g.,
grafana-server.exe).
5. Creating a Dashboard on Grafana
- Access the Grafana web interface by visiting http://localhost:3000 in your browser (default port 3000).
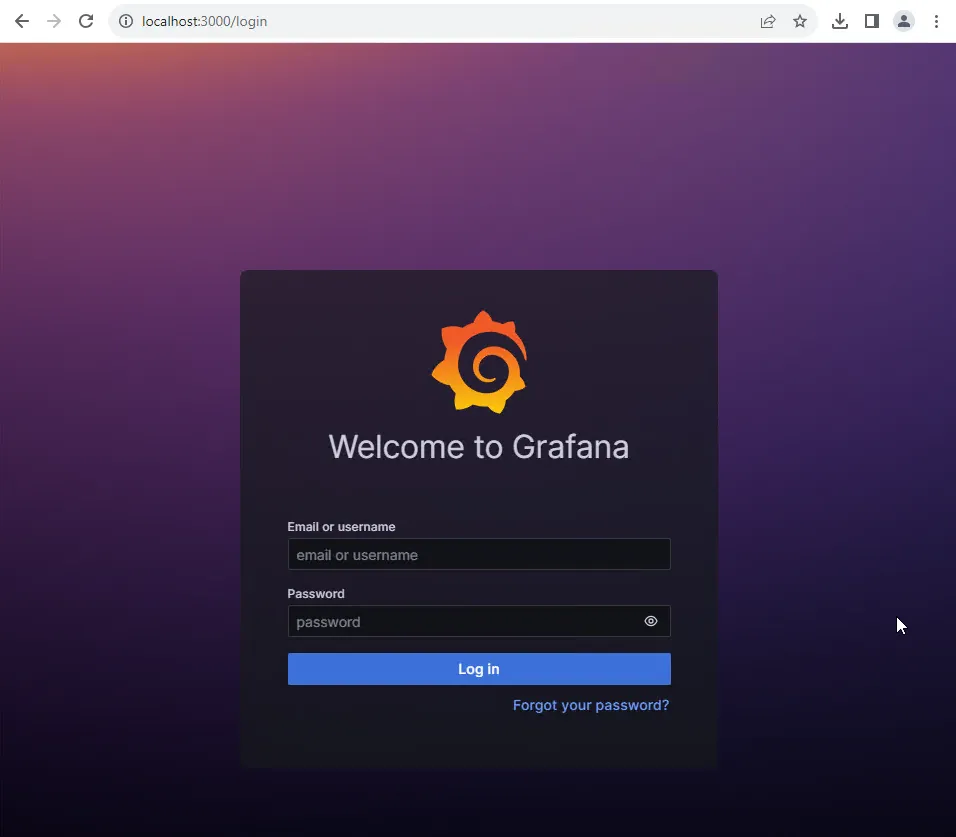
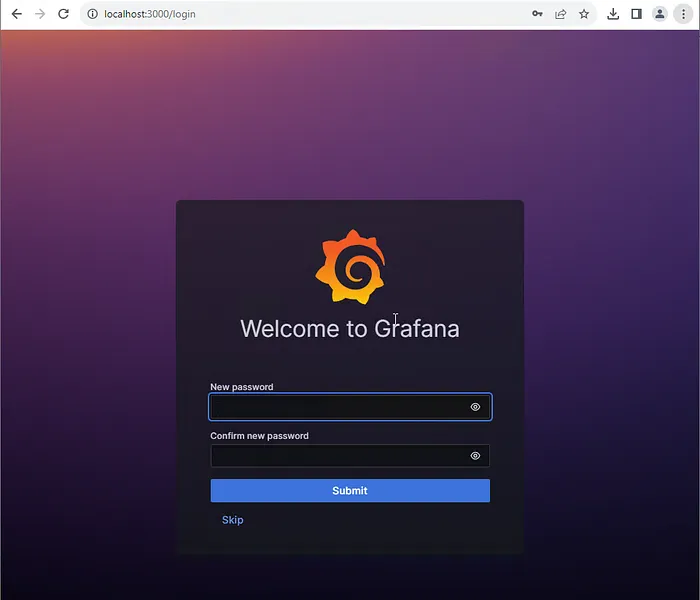
- Log in with the default credentials (admin/admin).
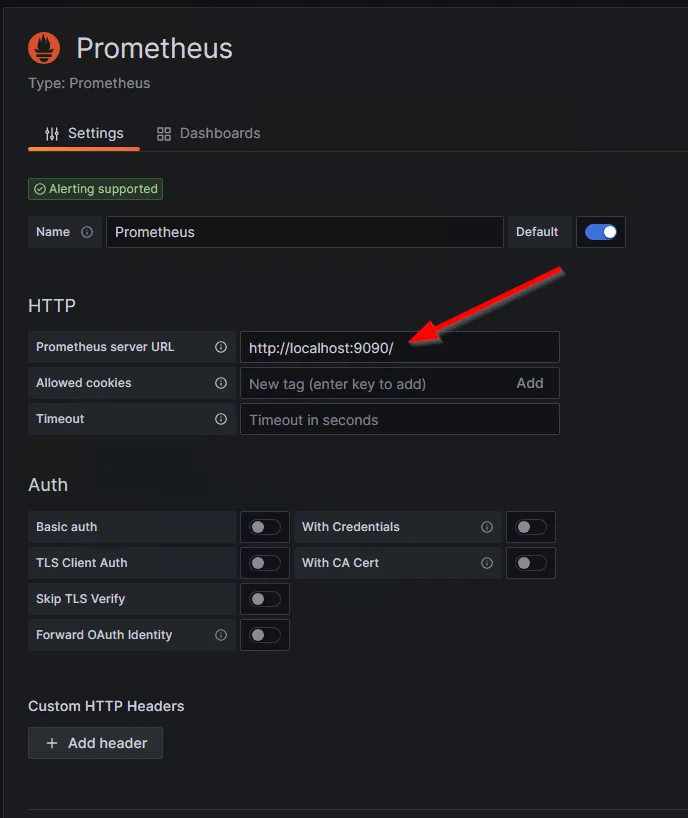
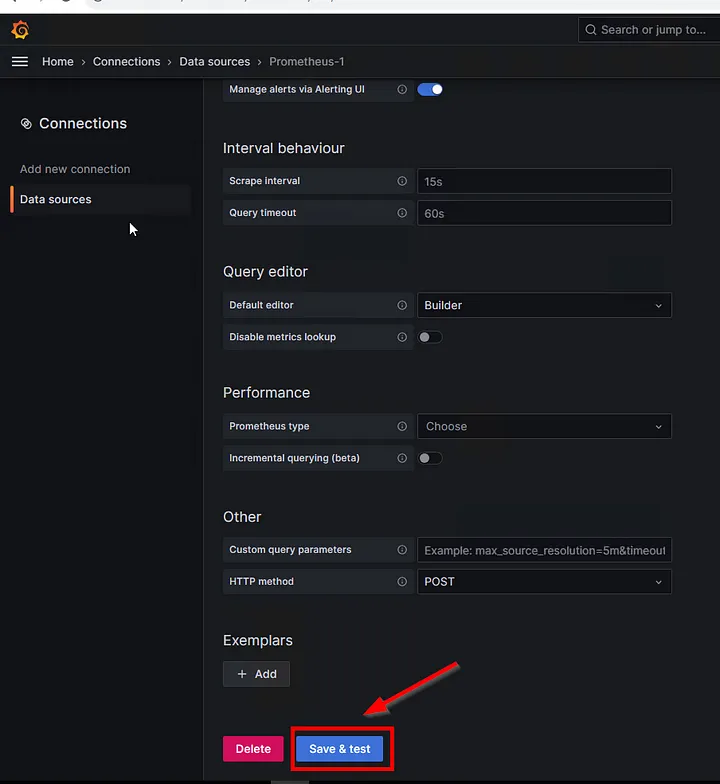
- Go to the “Configuration” menu, select “Data Sources,” and add a new data source. Choose “Prometheus” and provide the address of your Prometheus server (e.g., http://localhost:9090).
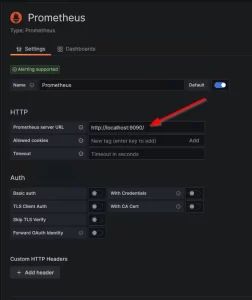
- Click “Save & Test” to add the data source.
- Navigate to the “Dashboard” section, click “New,” and select “Import.”
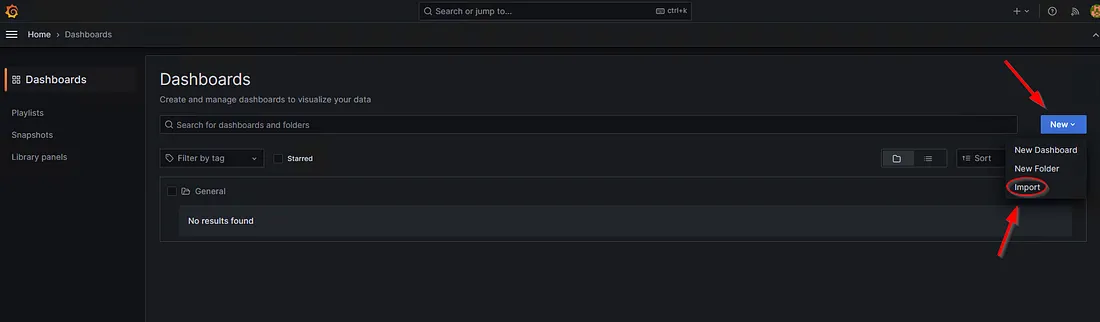
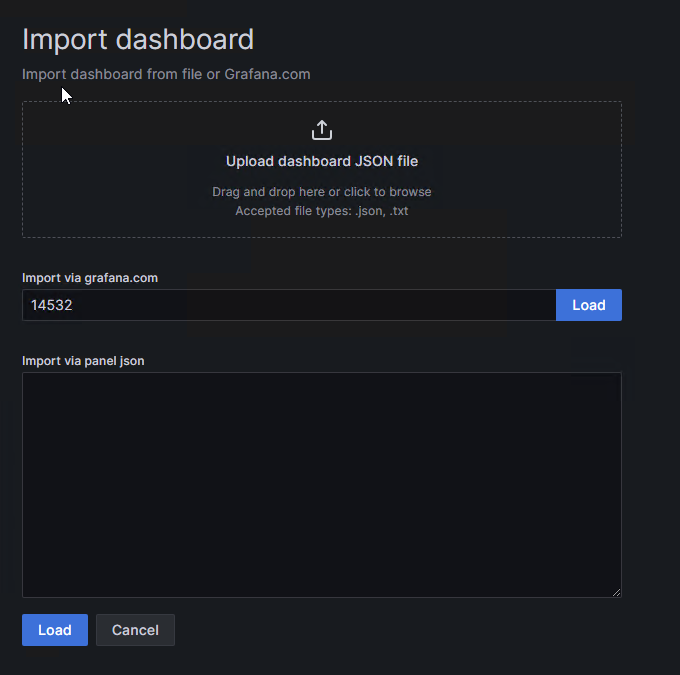
- Search for a Dashboard ID starting with a specific number on grafana.com, or directly import a JSON file.
IIS Dashboard ID:14532
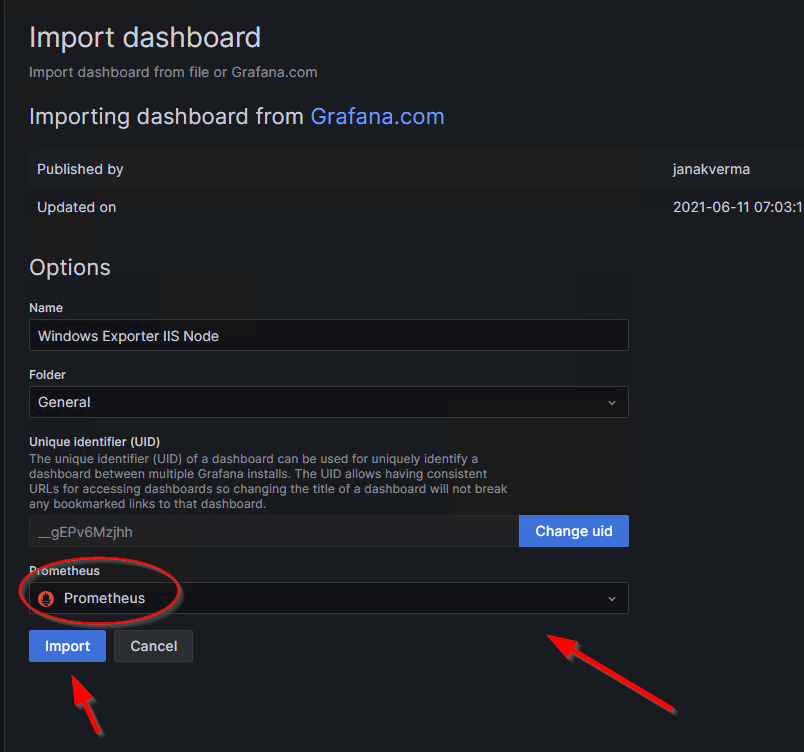
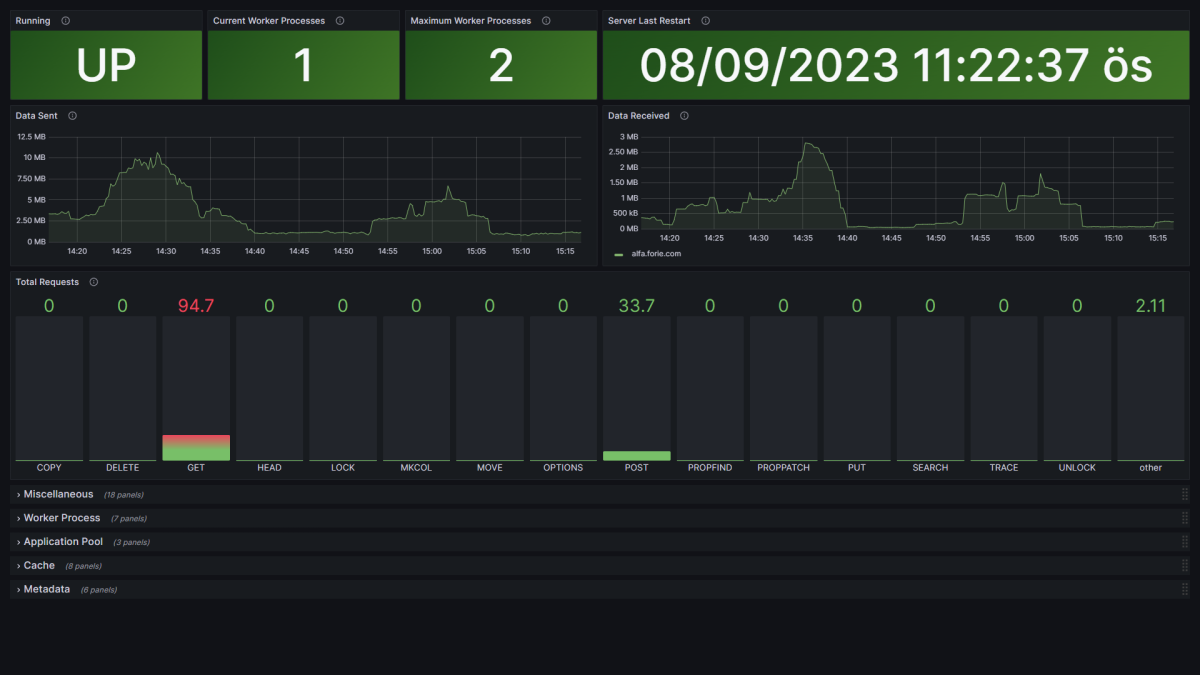
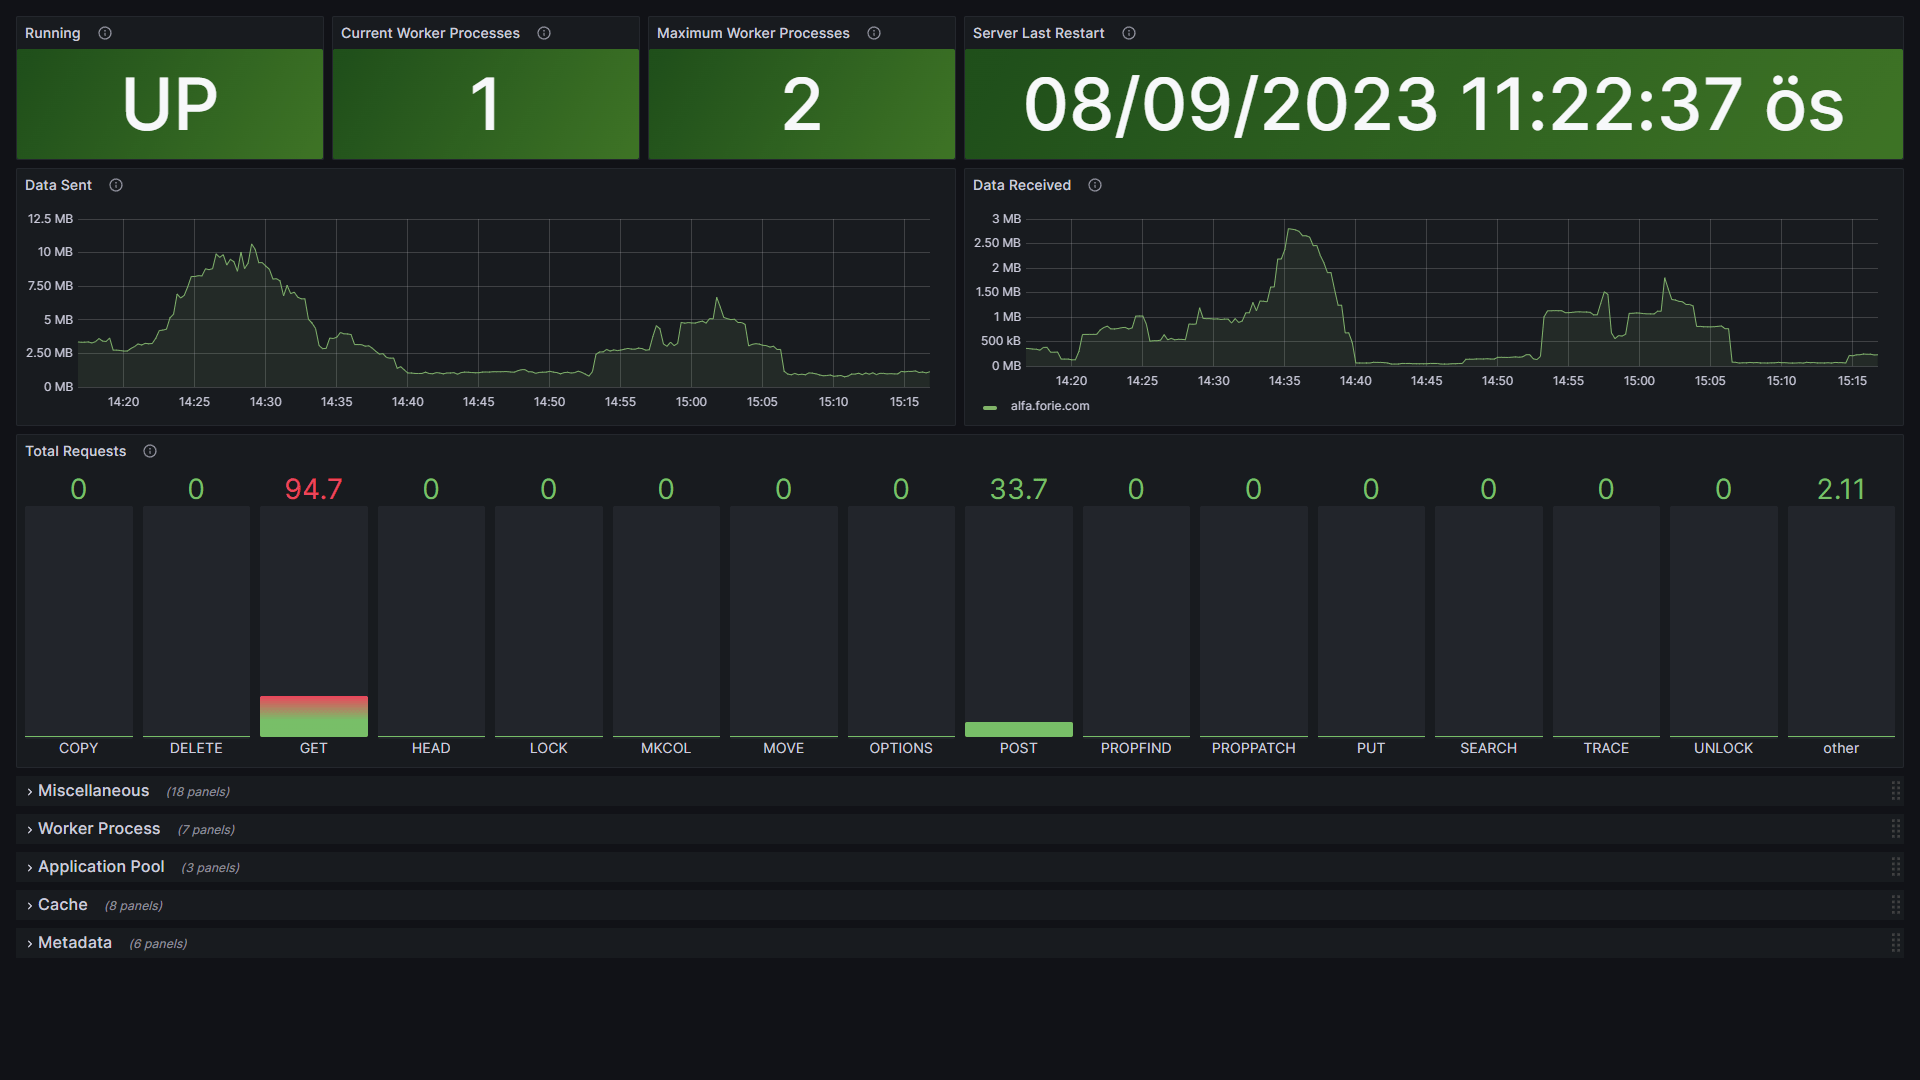
6. Observing the Dashboard
- You can observe IIS server monitoring data on the created dashboard. Grafana will help visualize the metrics obtained from Prometheus.
If you have any questions or details you would like to add, feel free to write me.