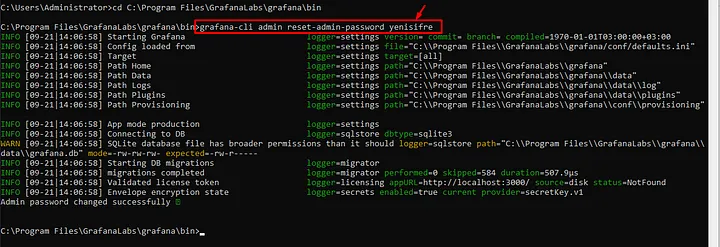
The first step is to download the official Grafana password reset tool. This tool is typically included with the Grafana installation. You can download it from the following link:
RabbitMQ is message queuing software that plays a significant role in distributed systems. You can access the article where I explain the RabbitMQ installation from here. You can use tools like Prometheus, Grafana, and WMI Exporter to monitor and analyze the performance of RabbitMQ servers in a Windows Server environment. Here is a step-by-step guide:
Step 1: Enabling the Built-in Plugin for RabbitMQ with Prometheus Support
RabbitMQ comes with built-in Prometheus and Grafana support.
The rabbitmq_prometheus plugin provides Prometheus metric collector support. It exposes all RabbitMQ metrics in Prometheus text format on a specific TCP port.
If the plugin is not already installed, navigate to the rabbitmq directory on your system and check the plugins folder for the rabbitmq_prometheus plugin.
If it’s not there, you can find the plugin in the official RabbitMQ plugin repository.
In our previous article, you can find information on how to perform monitoring on a Windows server
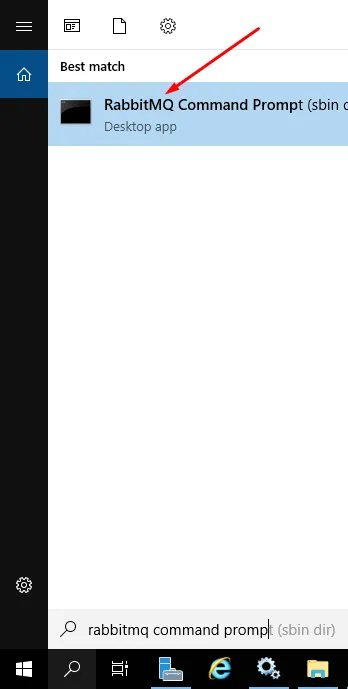
Open the RabbitMQ Command-Line Client.
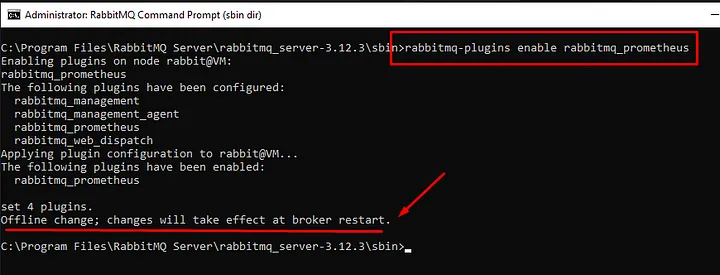
Enable the plugin by entering the following command:
rabbitmq-plugins enable rabbitmq_prometheus
rabbitmq-plugins enable rabbitmq_prometheus
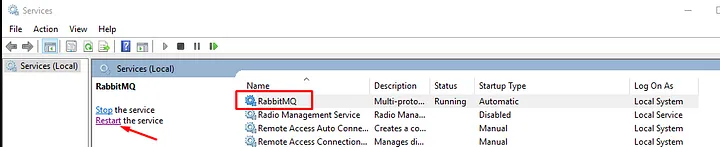
After enabling the plugin, you might need to restart the RabbitMQ server to activate it. To restart the server, access the service management, select RabbitMQ, and click on the restart button.
RabbitMQ restart
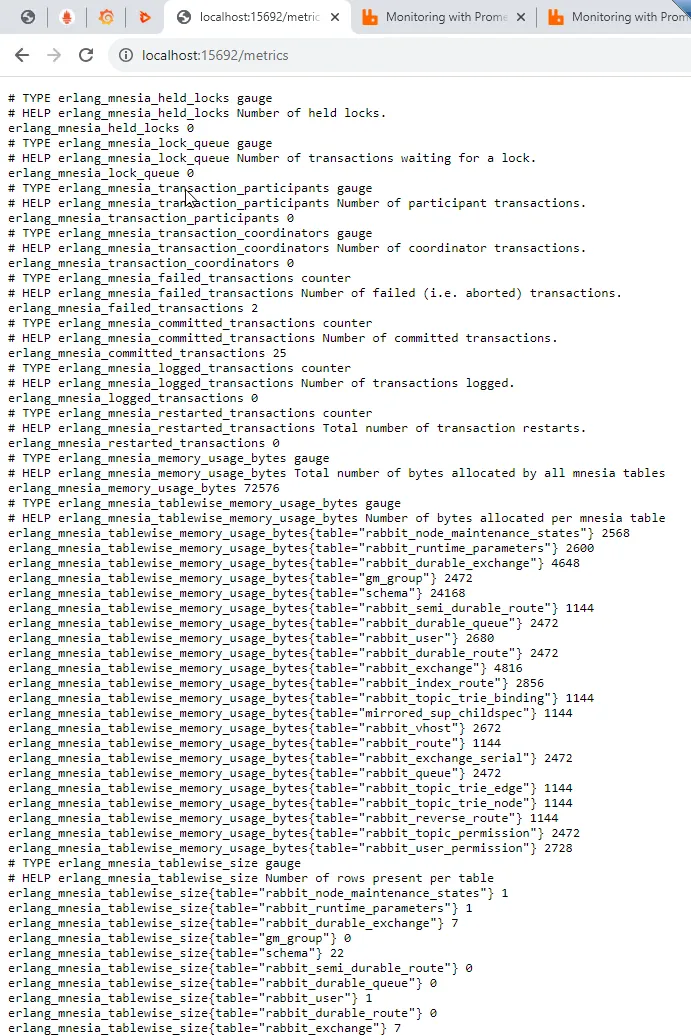
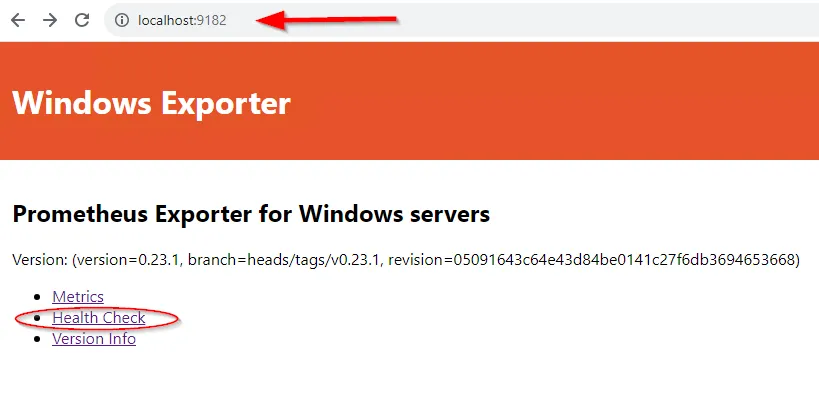
Finally, check the metrics by going to the address localhost:15962/metrics
Step 2: Installation and Configuration of Prometheus
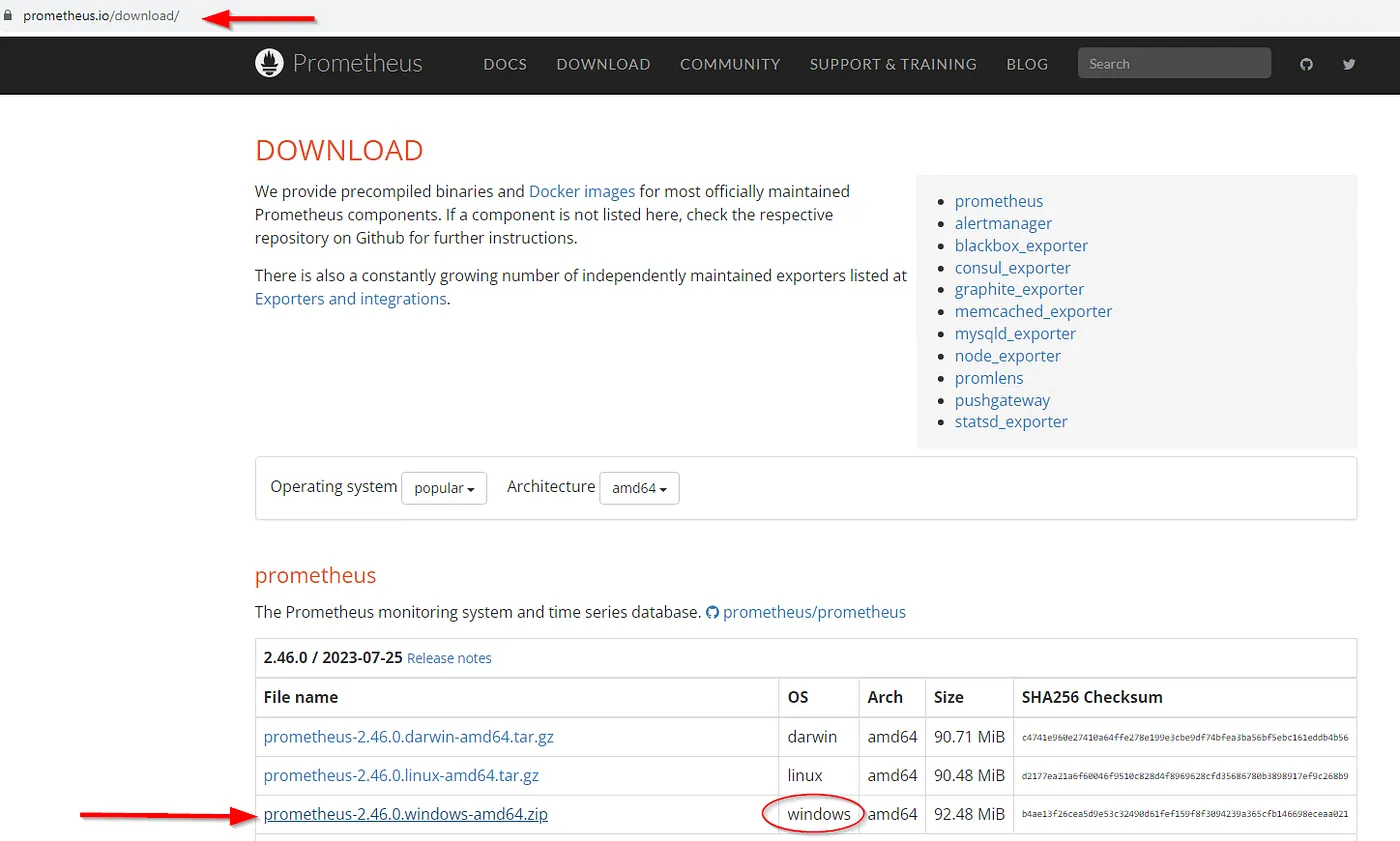
Download and install Prometheus on your Windows Server.
Create a configuration file named prometheus.yml.
In the prometheus.yml configuration file, add a scrape “job” to monitor RabbitMQ:
scrape_configs:-job_name:'rabbitmq'static_configs:-targets: ['rabbitmq-sunucu:15672'] # RabbitMQ Yönetim Arayüzü adresi
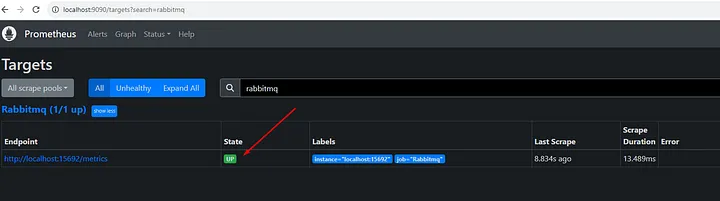
Verify the RabbitMQ connection added in the Prometheus web interface at localhost:9090. Check the Status/Targets section to ensure the RabbitMQ scrape target is present.
Step 3: Installation and Configuration of Grafana
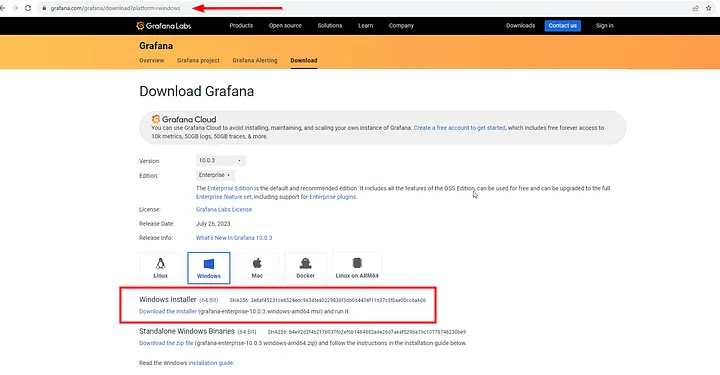
Download and install Grafana on your computer.
Access the Grafana interface.
Add Prometheus as a data source:
Open the side menu by clicking on the gear icon or pressing “Ctrl + Shift + ,”.
Go to “Data Sources”.
Click on the “Add data source” button.
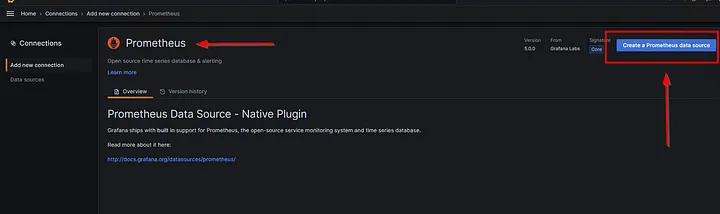
Choose “Prometheus” from the list of available data sources.
Configure the Prometheus connection details and save the data source.
Step 4: Creating and Visualizing Grafana Dashboard (ID 10991)
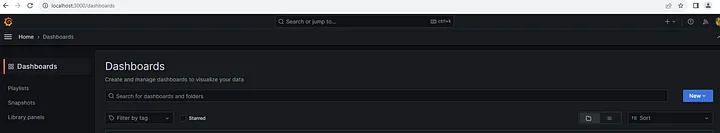
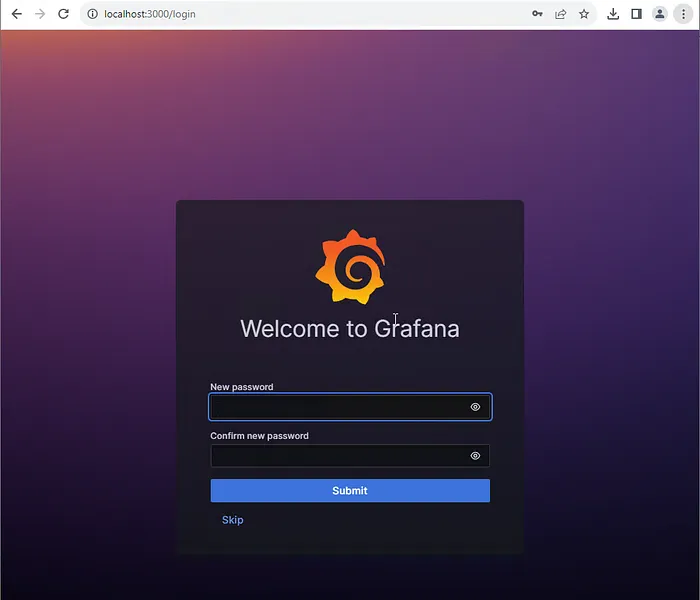
Access the Grafana dashboard at localhost:3000 in your web browser.
Click on the “Home” icon in the left sidebar to access the home dashboard.
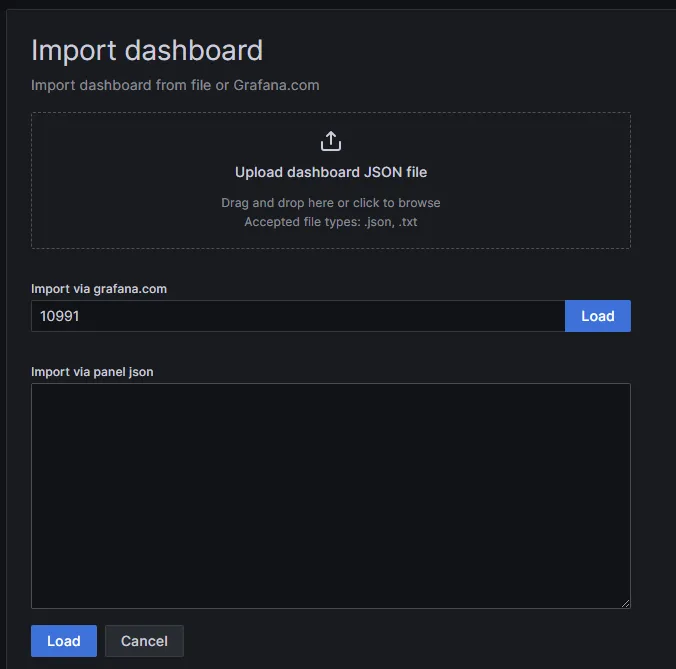
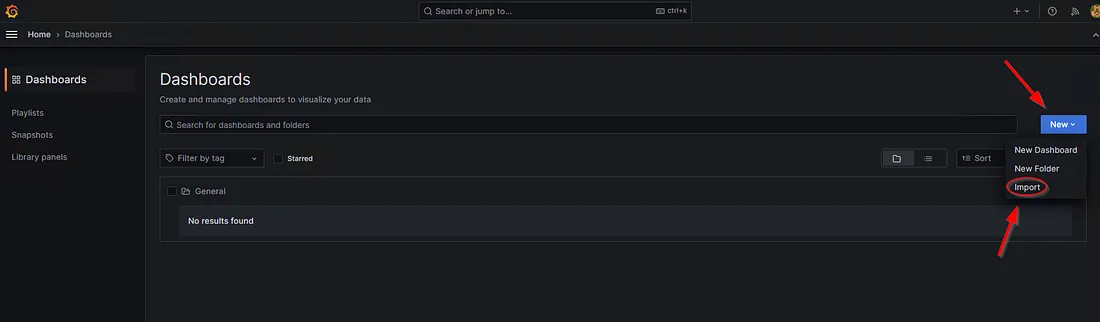
Click on the “Import” button in the top menu.
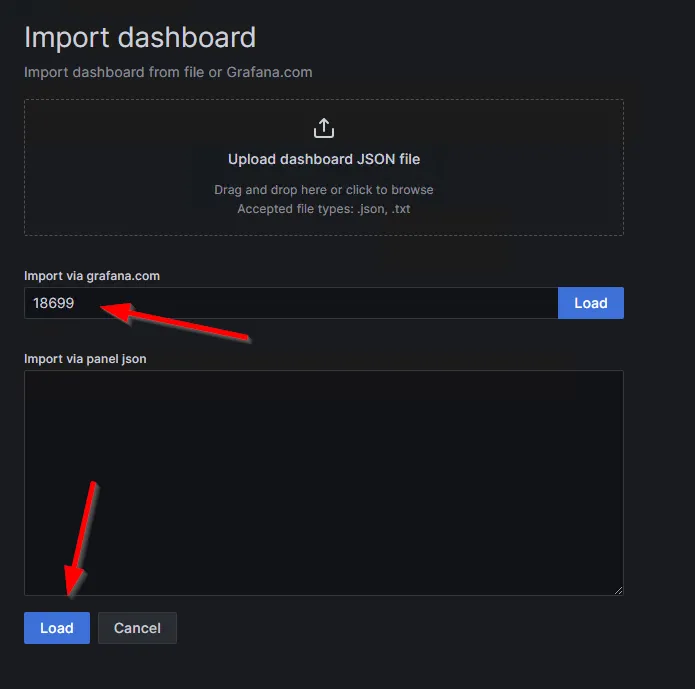
Select the option “Import via grafana.com”.
Enter the ID 10991 in the appropriate field.
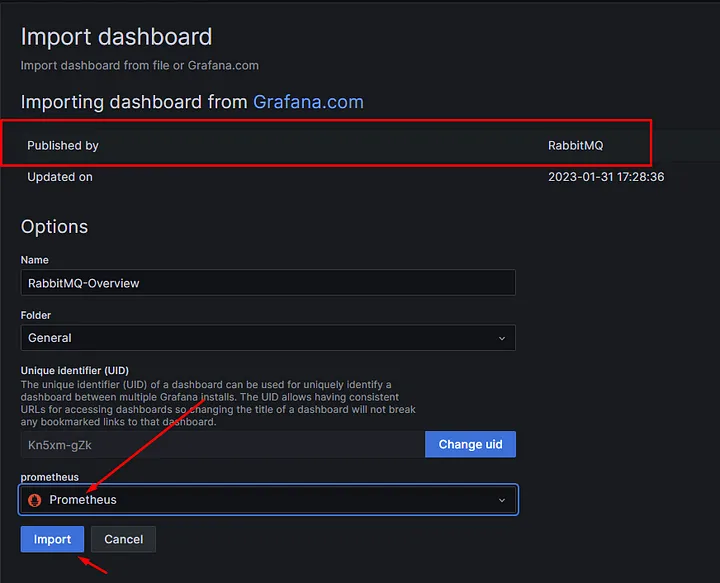
Note: We are installing the themethat RabbitMQ has officially published on its site.
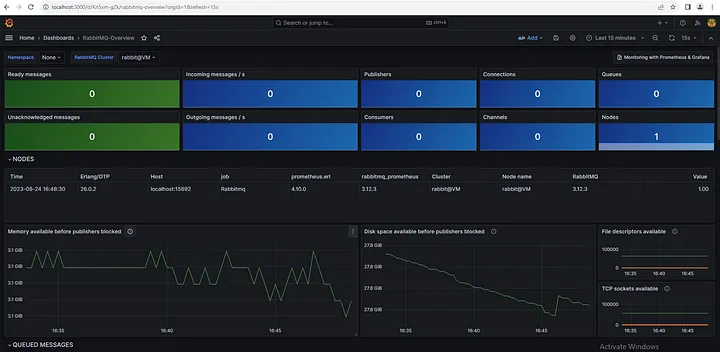
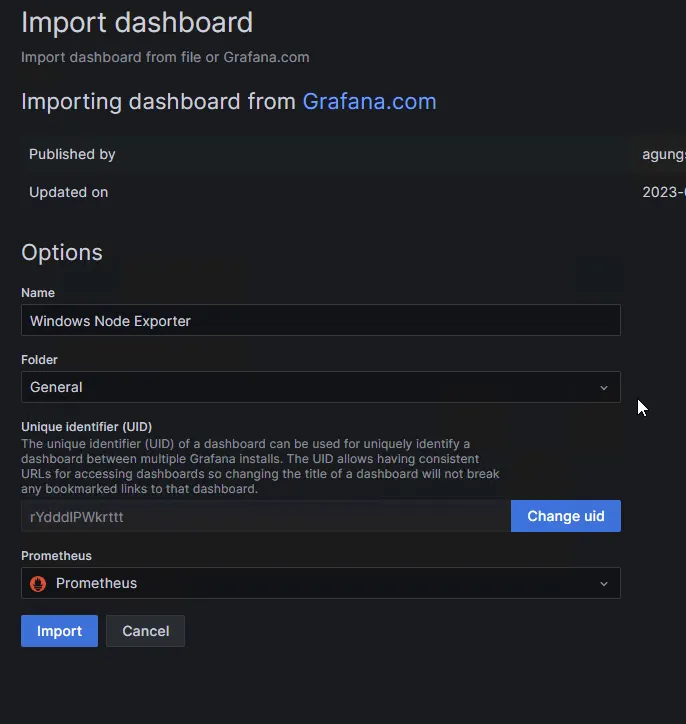
The RabbitMQ monitoring dashboard example will be imported.
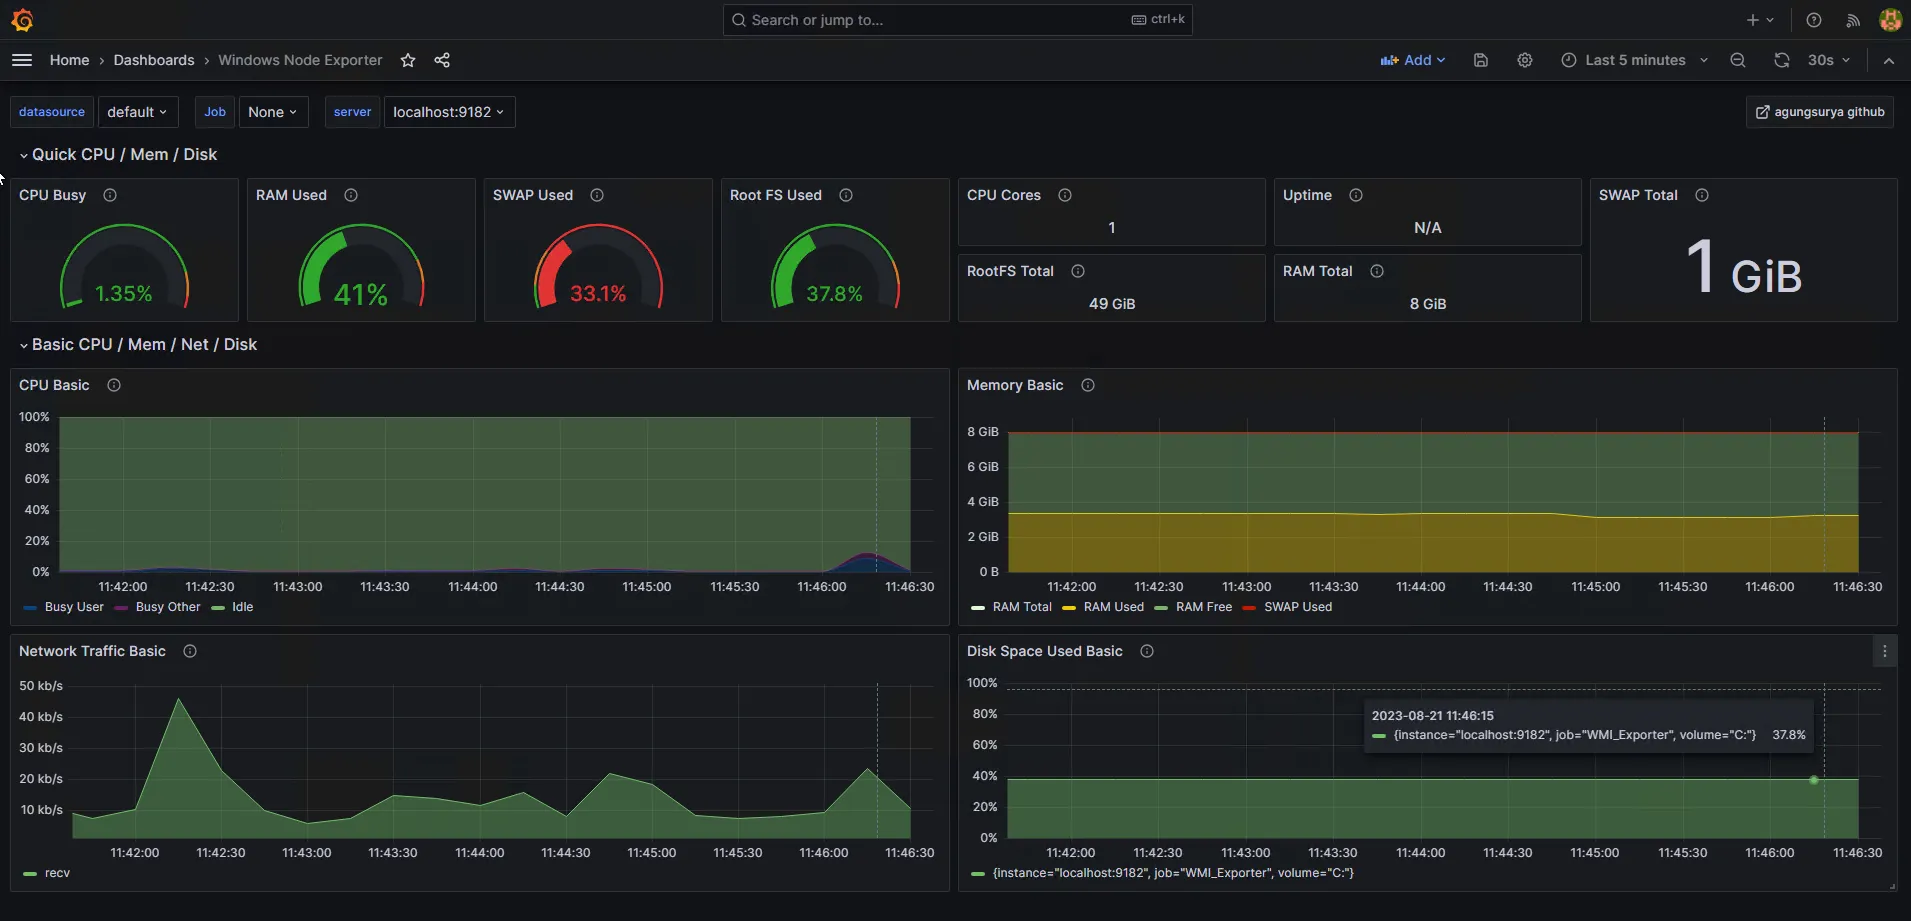
Once imported, you’ll be able to view and interact with the RabbitMQ metrics visualization.
Your questions and feedback are important to me. Every question and feedback you provide helps me improve my service. I’m here to provide you with the best support and address your needs. Thank you…
If you have any questions or details you would like to add, feel free to write me.
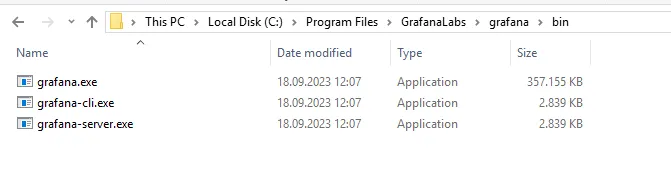
Extract the downloaded archive and copy the files to a suitable directory.
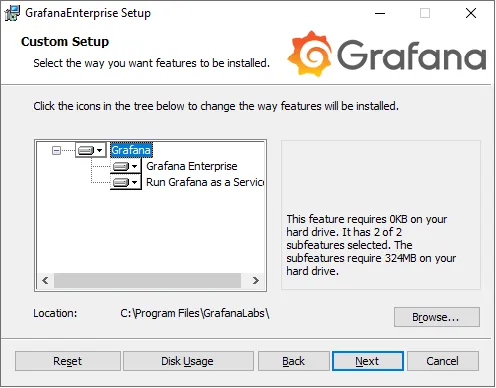
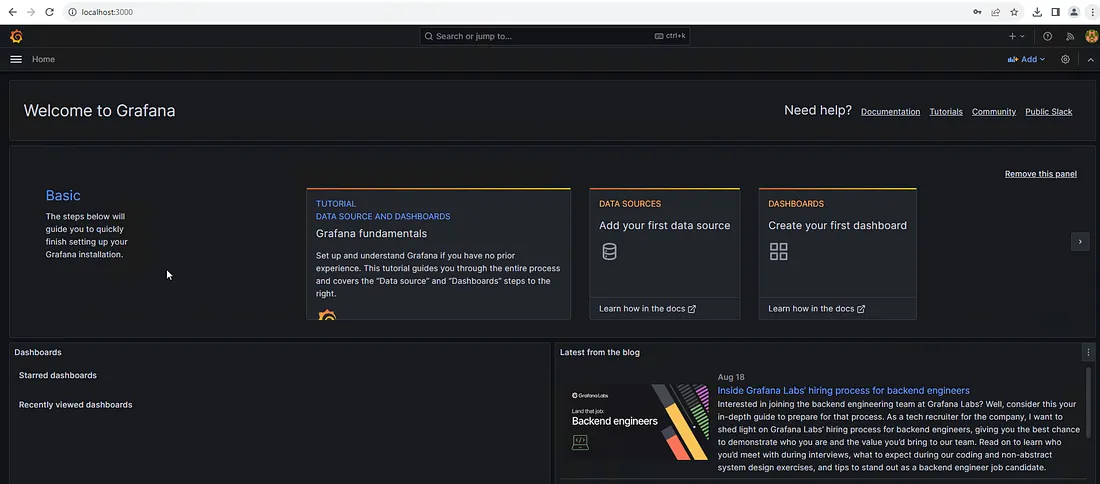
Start Grafana: Launch Grafana using the command line (e.g., grafana-server.exe).
Grafana setup
5. Creating a Dashboard on Grafana
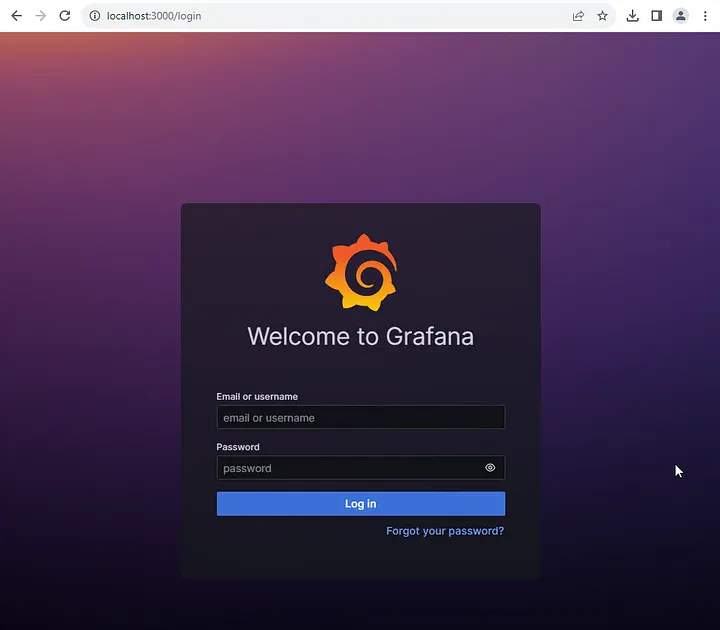
Access the Grafana web interface by visiting http://localhost:3000 in your browser (default port 3000).
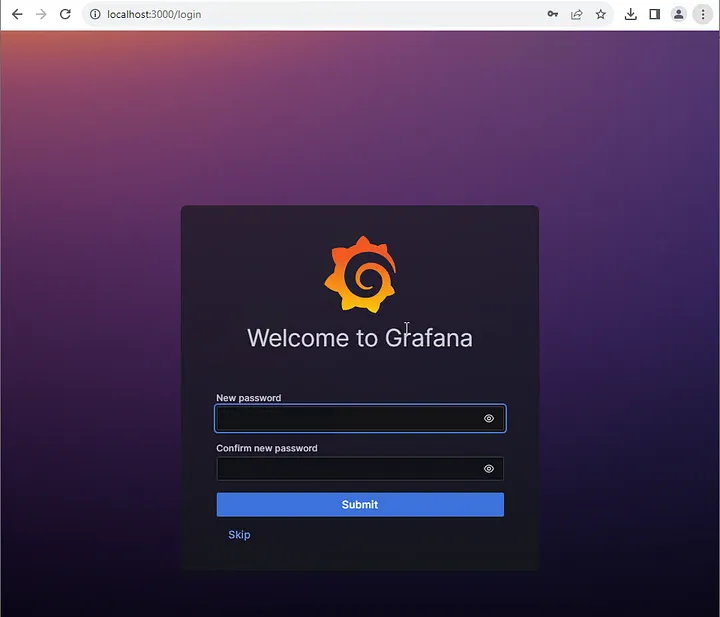
Log in with the default credentials (admin/admin).
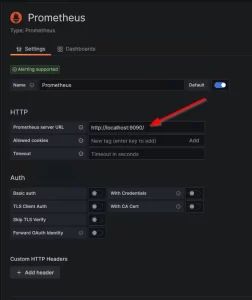
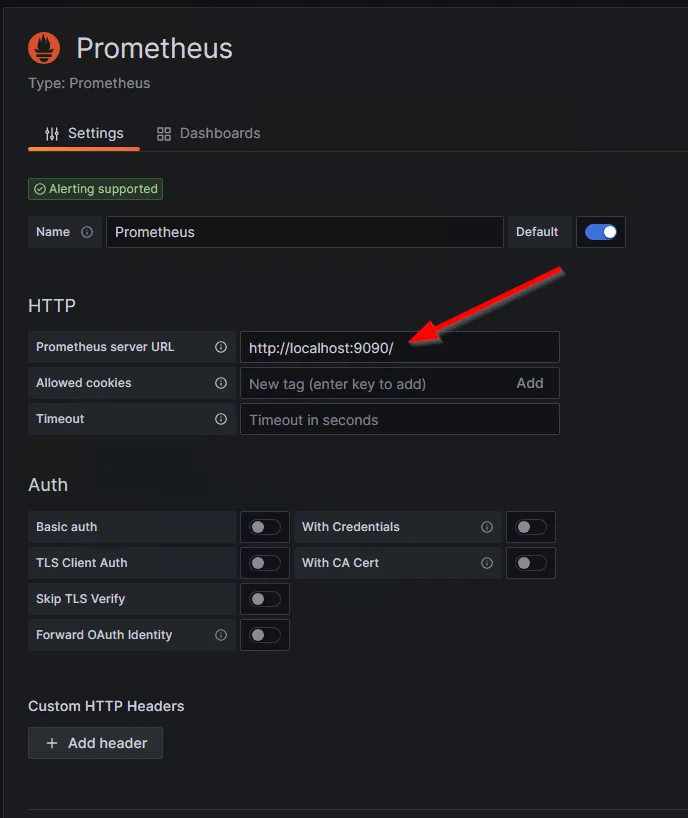
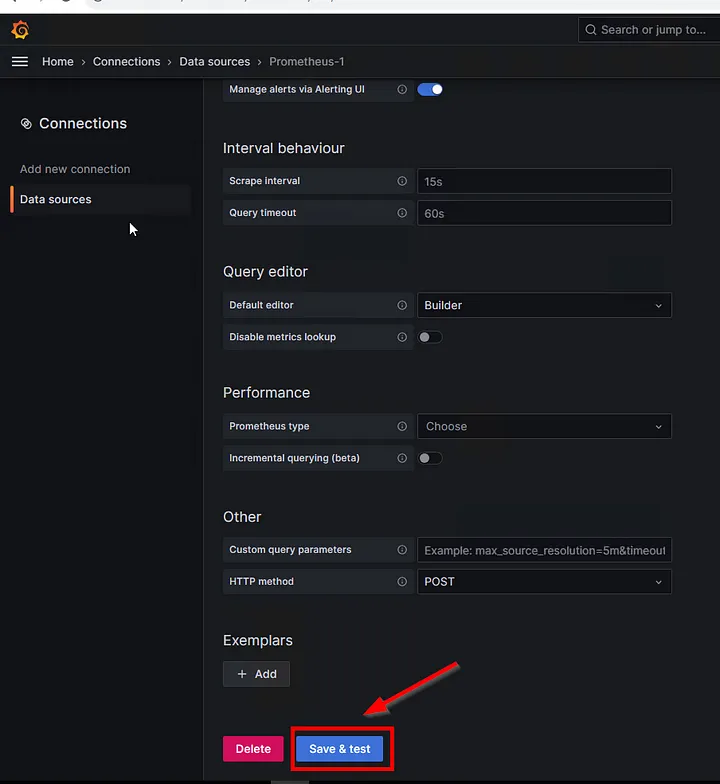
Go to the “Configuration” menu, select “Data Sources,” and add a new data source. Choose “Prometheus” and provide the address of your Prometheus server (e.g., http://localhost:9090).
Click “Save & Test” to add the data source.
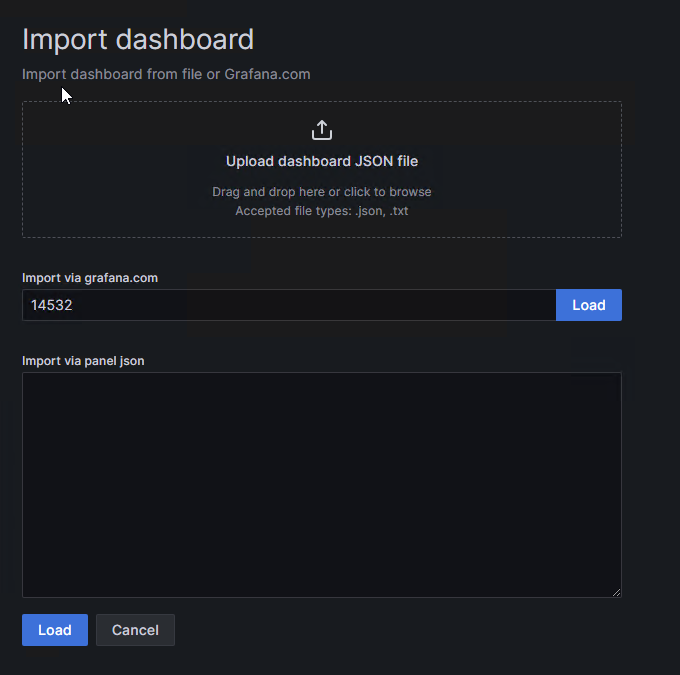
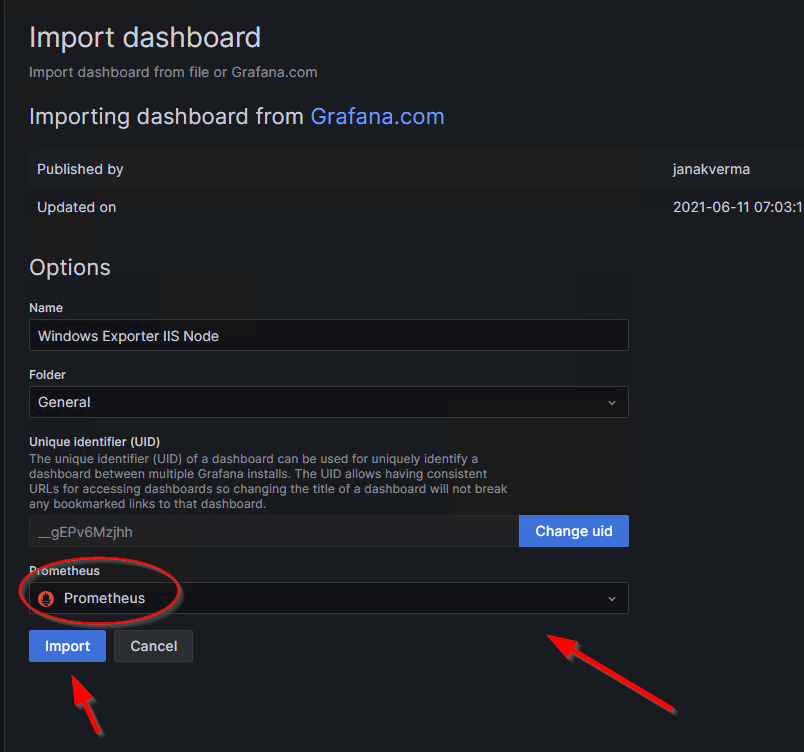
Navigate to the “Dashboard” section, click “New,” and select “Import.”
Search for a Dashboard ID starting with a specific number on grafana.com, or directly import a JSON file.
IIS Dashboard ID:14532
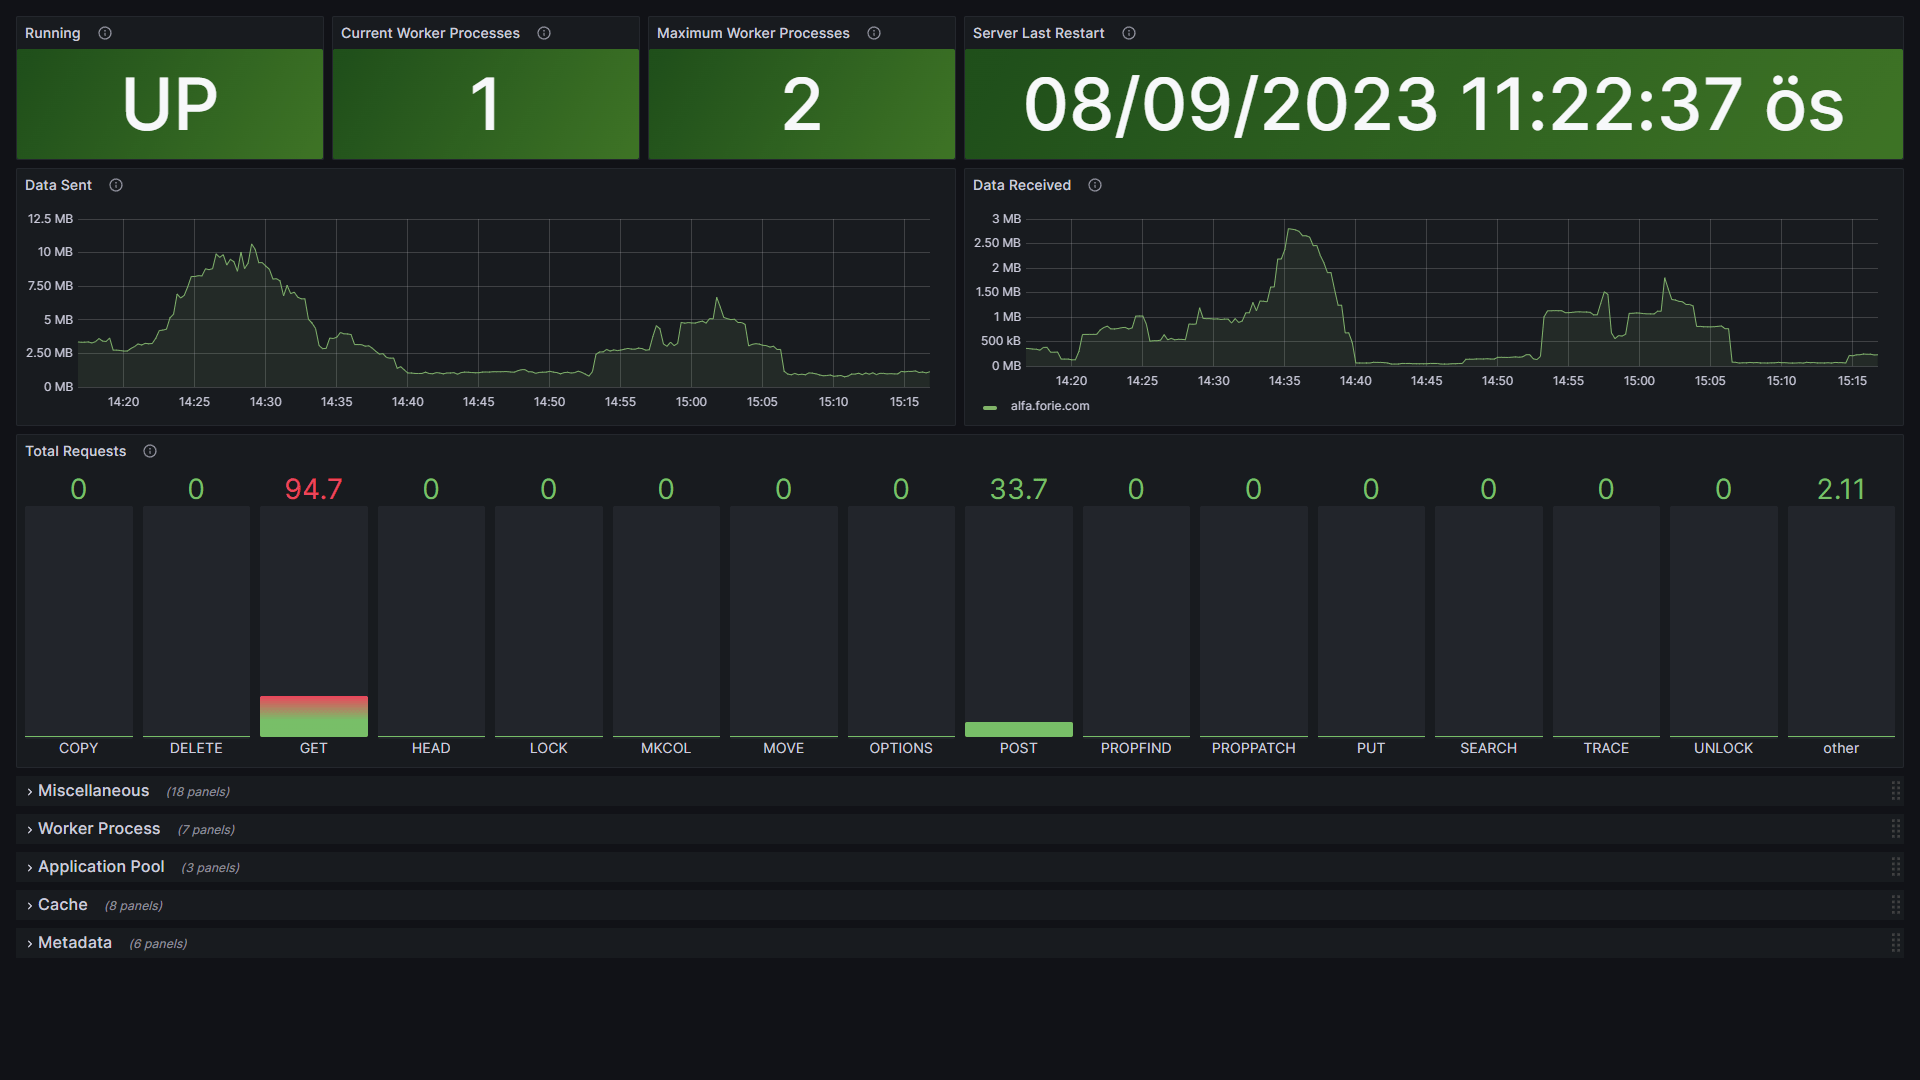
6. Observing the Dashboard
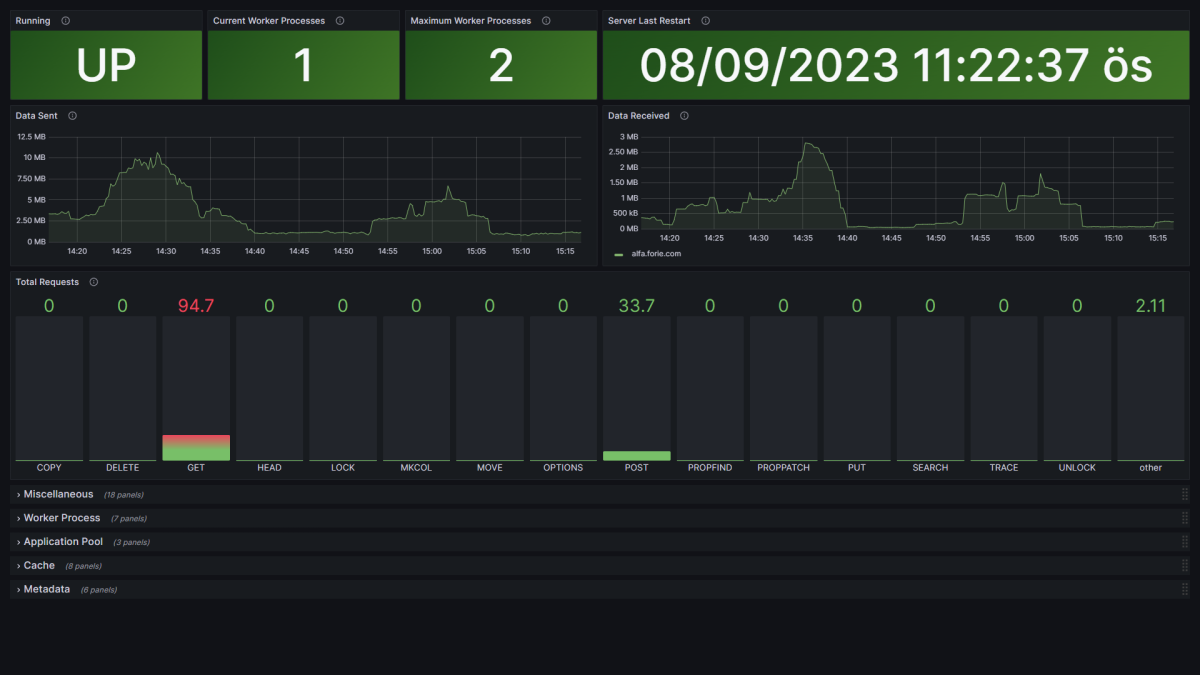
You can observe IIS server monitoring data on the created dashboard. Grafana will help visualize the metrics obtained from Prometheus.
IIS Monitoring
If you have any questions or details you would like to add, feel free to write me.
Continuing our guide, we will explore the process of setting up monitoring for Microsoft SQL Server (MSSQL) in your Windows Server environment. Monitoring your MSSQL instance is crucial for maintaining database performance, identifying bottlenecks, and ensuring optimal operations.
Here’s how to perform this comprehensive monitoring:
TL;DR
Enable SQL Server Agent: Activate the SQL Server Agent for interaction with external collectors such as Prometheus.
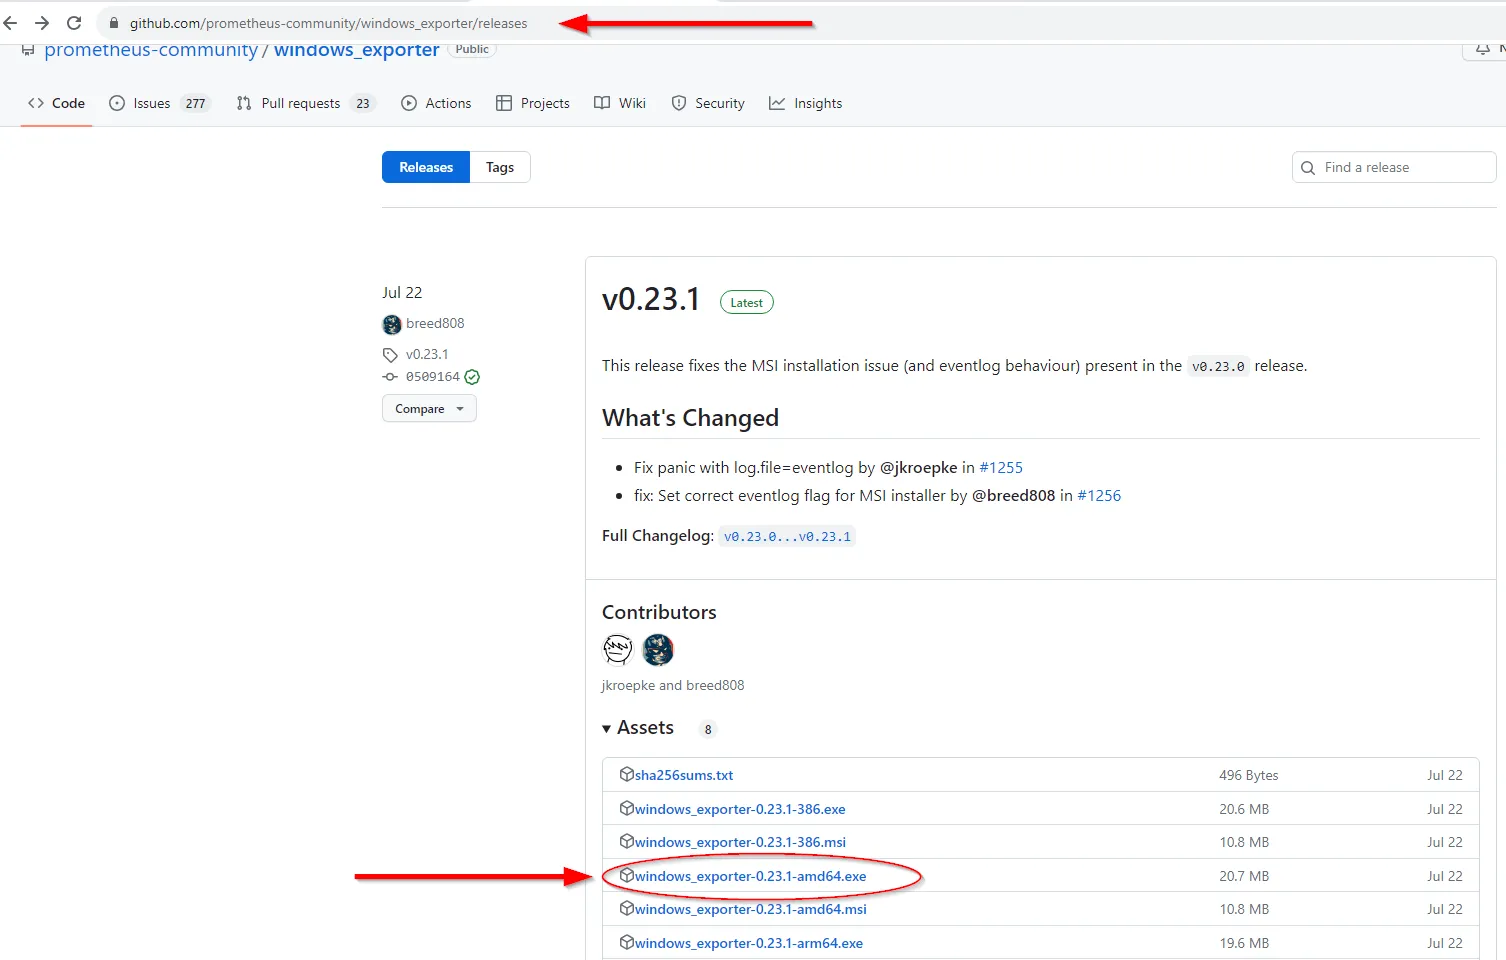
Install Prometheus Windows Exporter: Download and install the Prometheus Windows Exporter from GitHub.
Set Up Prometheus Scraper/Database: Install Prometheus on your monitoring server/computer and configure the scraper.
Access Prometheus Server and Add Targets: Access the Prometheus server through a browser and add a new target.
Query SQL Server Processes: Execute the necessary query to query SQL Server processes.
Install Grafana and Connect to Prometheus: Install Grafana, connect it to the Prometheus server, and visualize the data.
In our previous article, you can find information on how to perform monitoring on a Windows server.
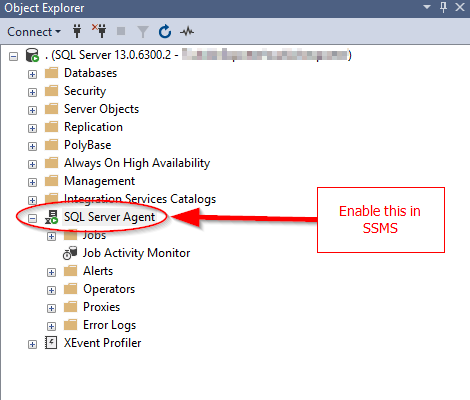
Enable SQL Server Agent in SSMS:
To allow external collectors (e.g., Prometheus) to query the SQL Server engine, enable the SQL Server Agent.
SQL Server Agent
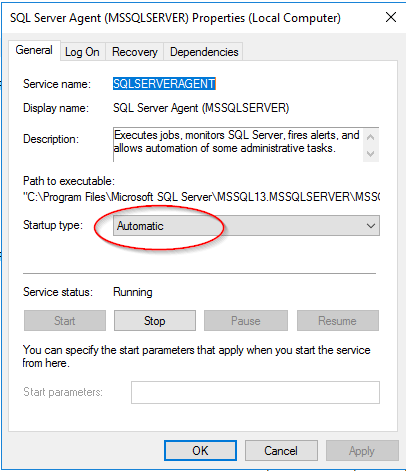
Change the startup type of the SQL Server Agent service to “Automatic” so that it starts automatically upon system startup.
Services / Automatic
2.Install Prometheus Windows Exporter:
Download the Prometheus Windows Exporter from GitHub.
Use the installer found in the “Assets” section to install the exporter.
You can use the default Windows node exporter provided by Prometheus, which includes basic SQL Server metrics. No additional exporter installation is needed.
Install the exporter using the MSI installer.
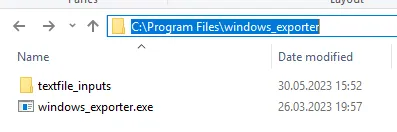
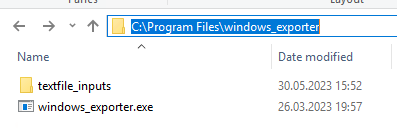
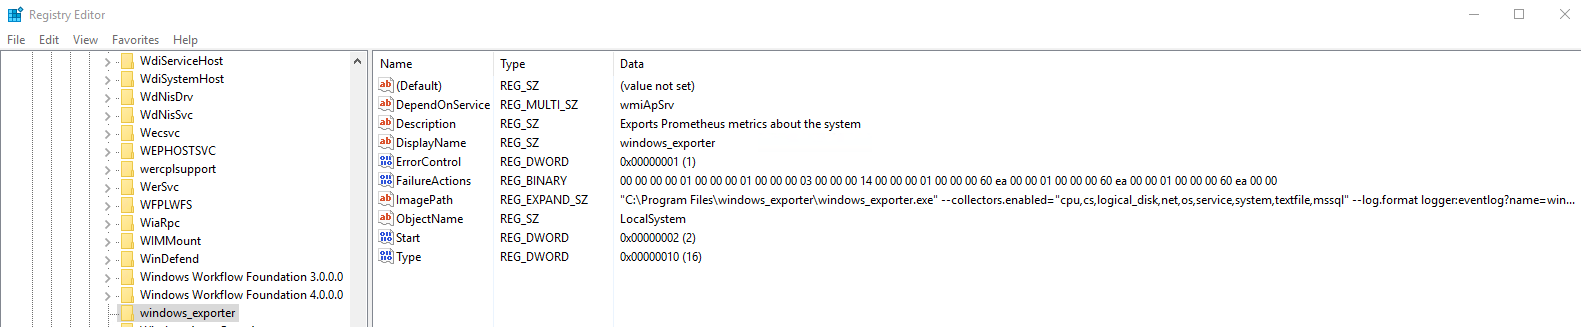
After installation, the binary will be located in theC:\Program Files\windows_exporterfolder.
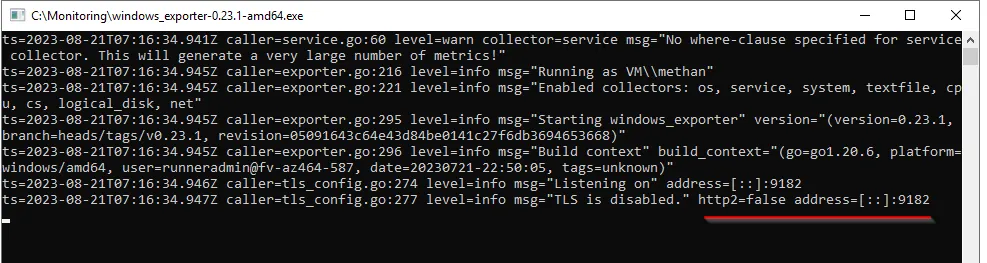
If a process/task named “windows_exporter” is running, terminate it, as we will need to manually start the exporter with some additional flags.
Manually run the exporter with the following command to fetch SQL Server statistics:
Replace “MSSQLSERVERIP” with the actual IP address of your Windows server.
Save and close the file.
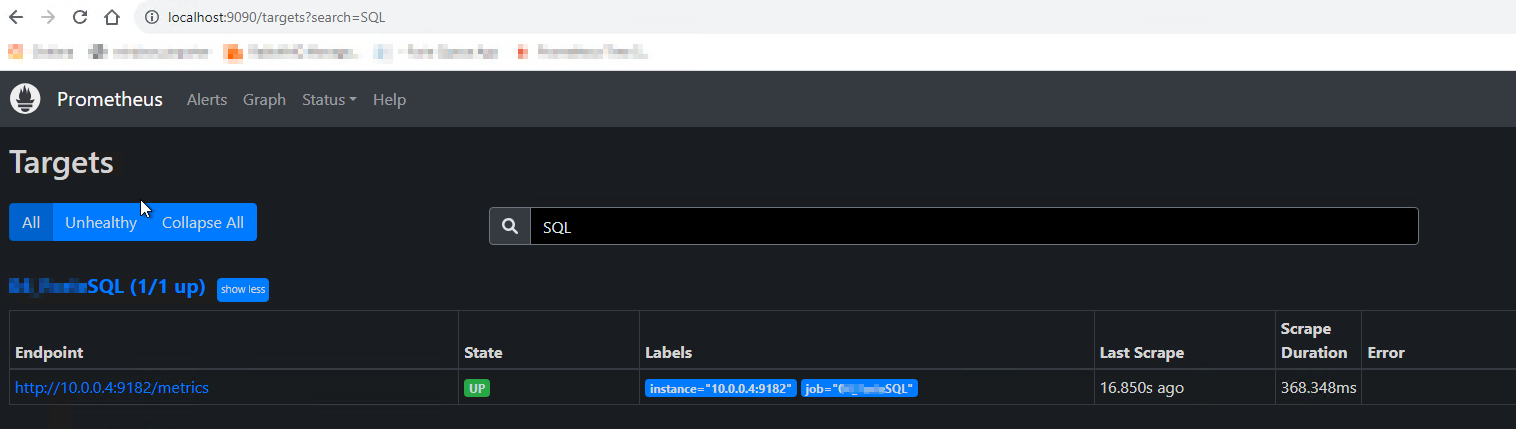
4.Access the Prometheus Server and Add Targets:
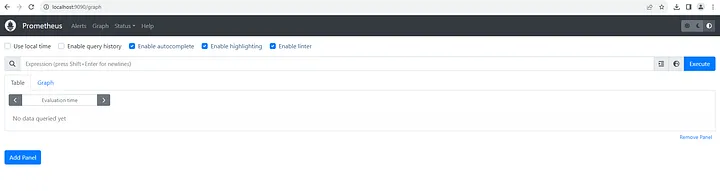
Open a browser and go to localhost:9090
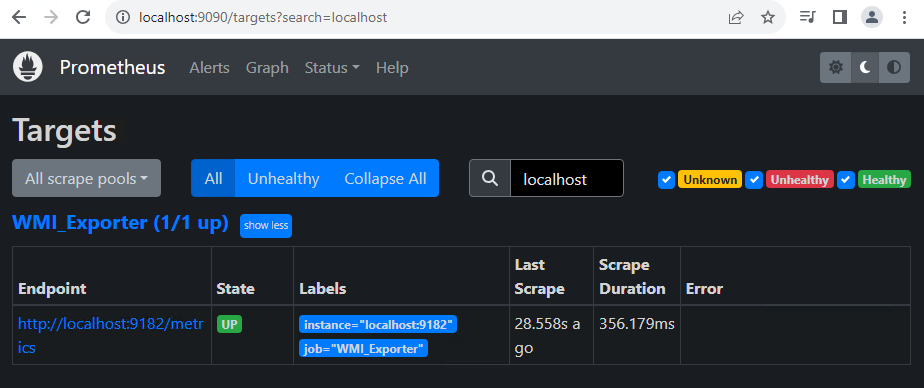
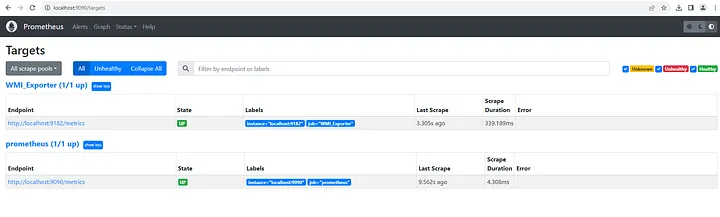
In the Status -> Targets tab, make sure the target at MSSQLSERVERIP:9182/metrics is UP.
Prometheus — UP
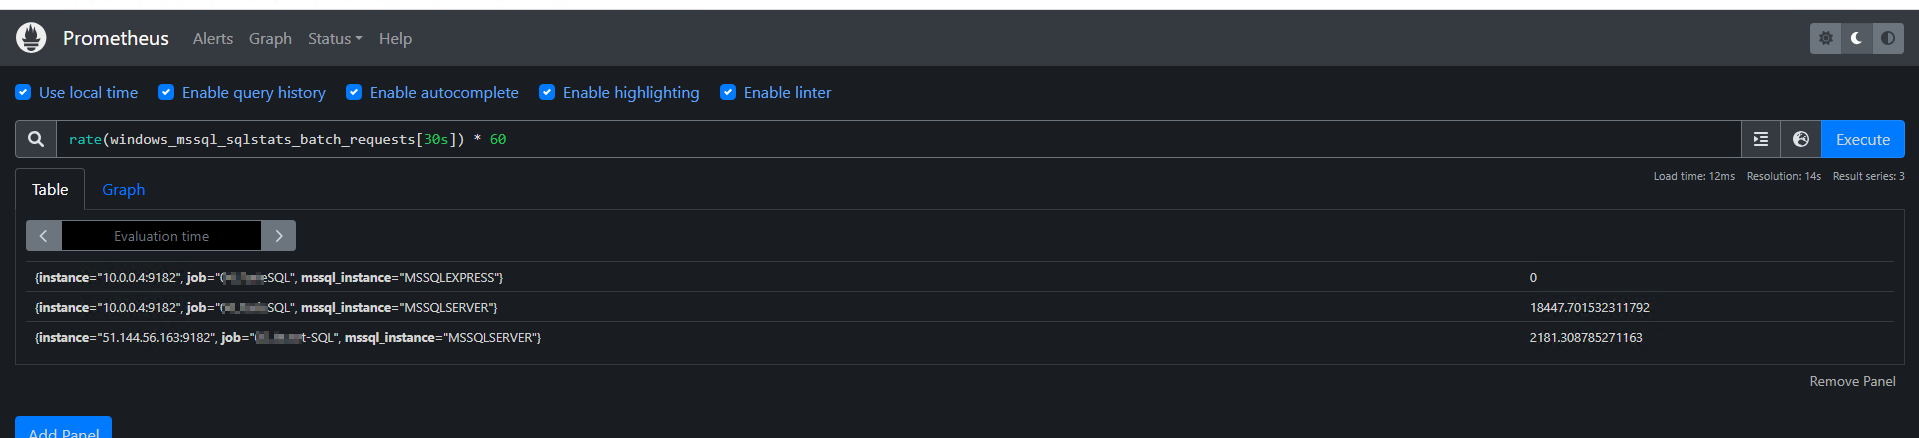
5. Query SQL Server Processes Through Prometheus:
Tarayıcınızı açın ve Prometheus sunucusuna gidin. Varsayılan olarak localhost:9090 .Open your browser and go to the Prometheus server. By default, it’s localhost:9090
Click on the “Console” tab in the upper left corner. This is where you can run PromQL queries.
Query SQL Server processes by entering the following query:
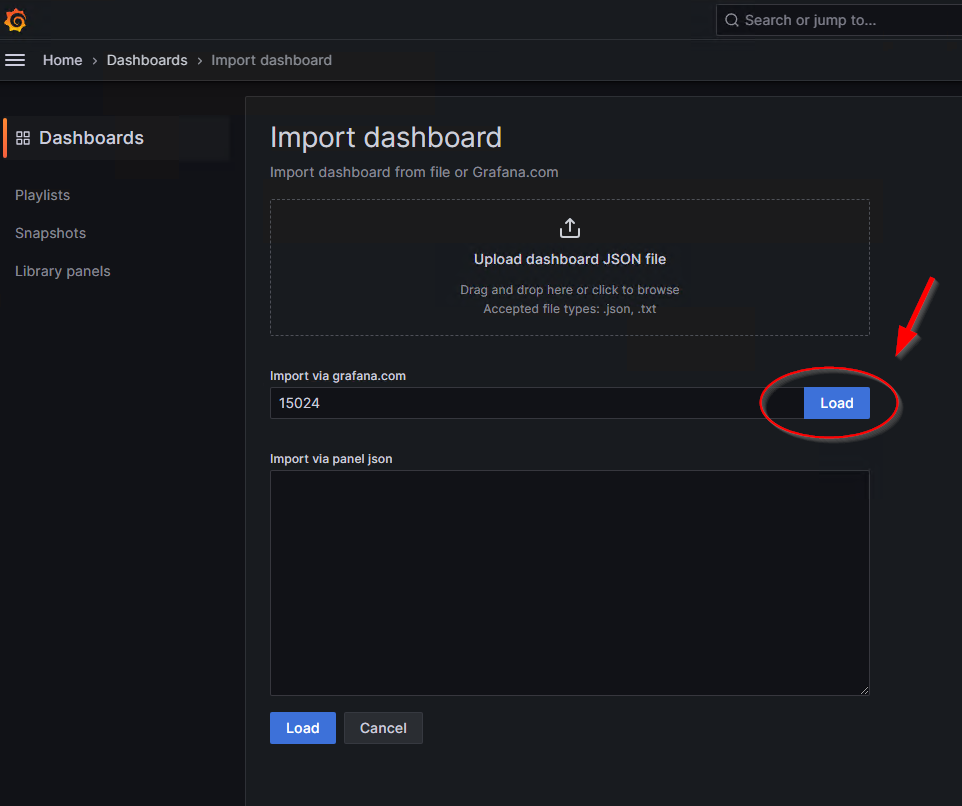
Install Grafana and access the interface at localhost:3000.
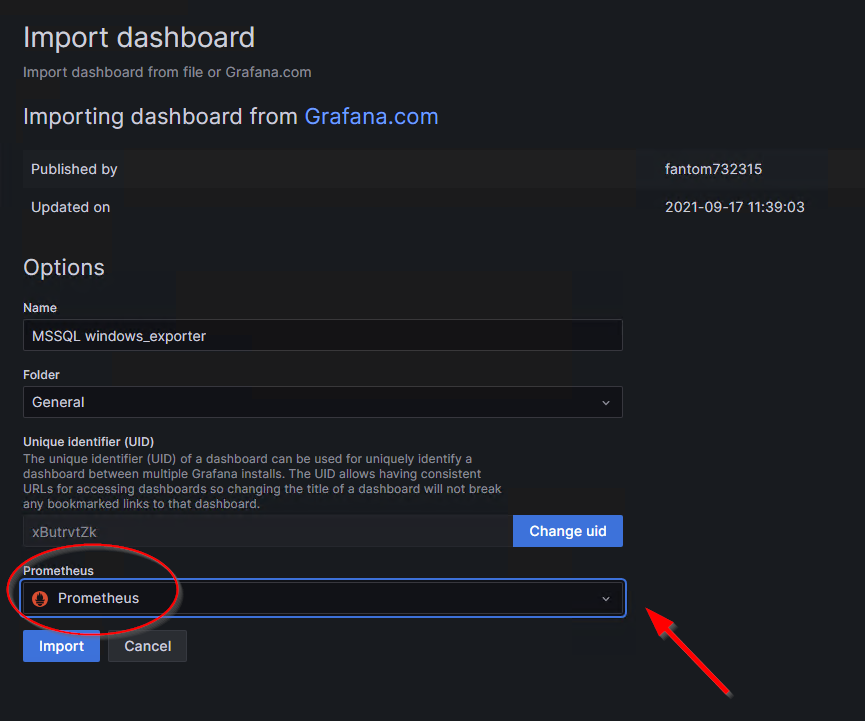
Use the “Import” option to add the MSSQL Windows Exporter Dashboard theme. Enter ‘15024’ as the ID in the “Import via grafana.com” section and proceed with “Load.”
In the “Data Sources” section, add the “Prometheus” data source and “Import” it.
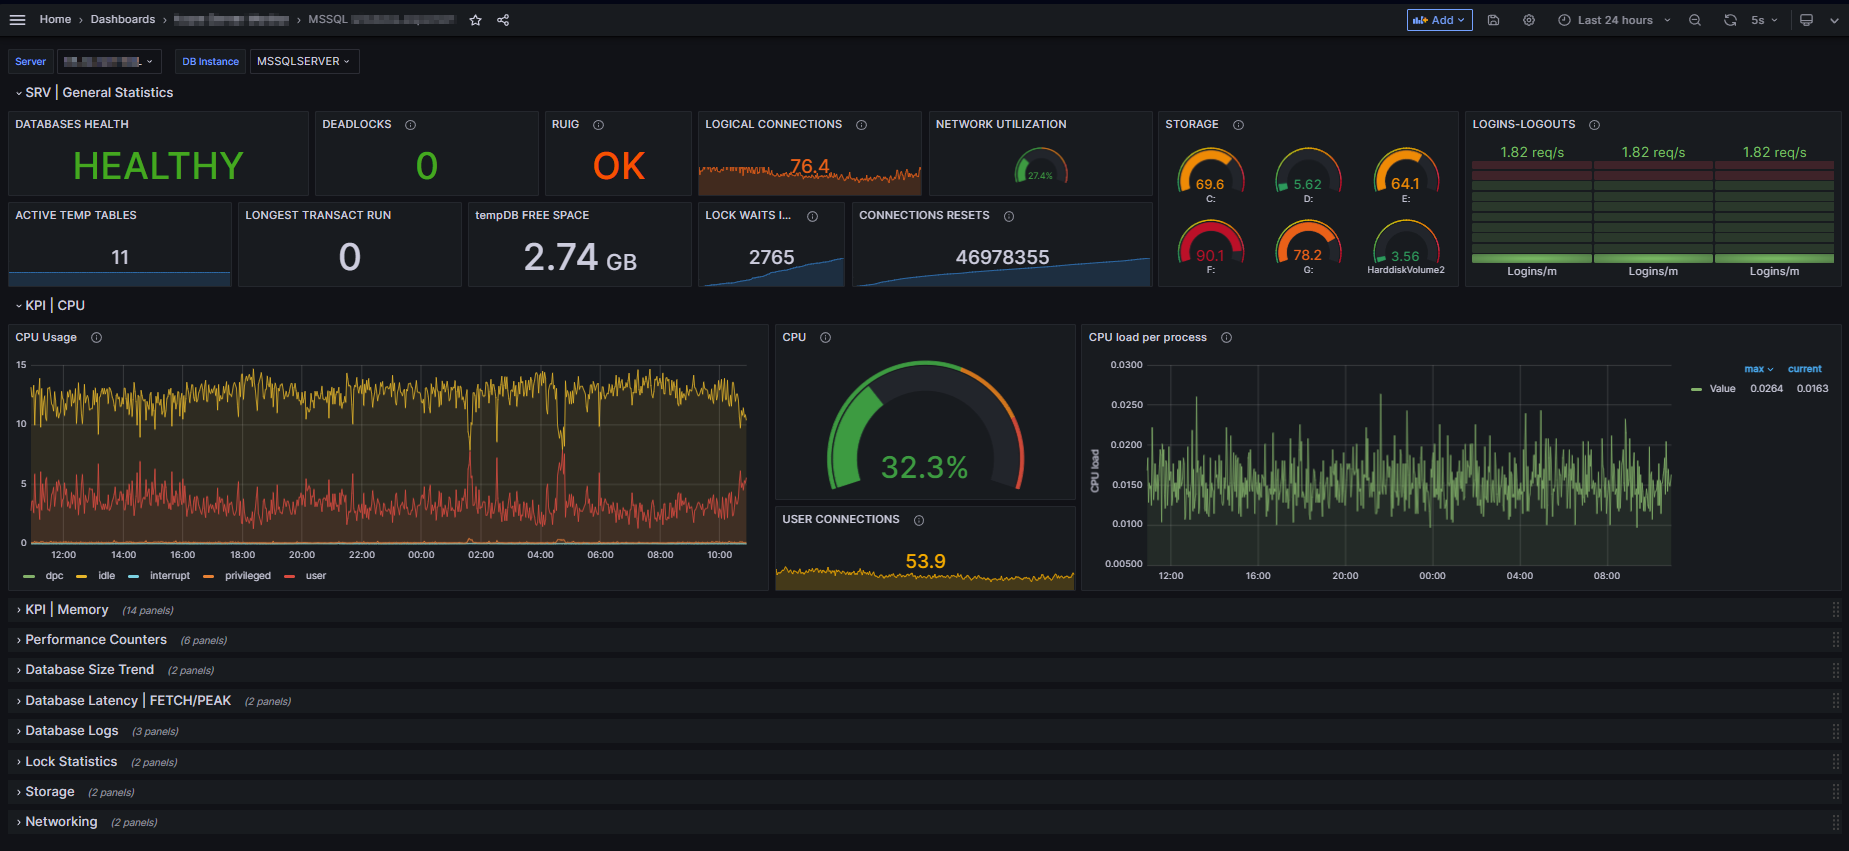
Now, you can visually examine SQL Server statistics in the added dashboard.
MSSQL Monitoring
If you have any questions or details you would like to add, feel free to write me.
Let’s start by outlining the general steps for setting up a monitoring system using Prometheus, Grafana, and WMI Exporter on Windows Server. Keep in mind that technologies and versions may change over time, so it’s important to refer to the most up-to-date documentation and resources.
Define Requirements:
Determine which version of Windows Server you will use.
Download the latest versions of Prometheus and Grafana.
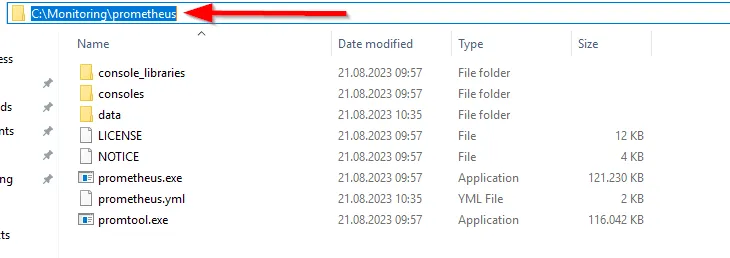
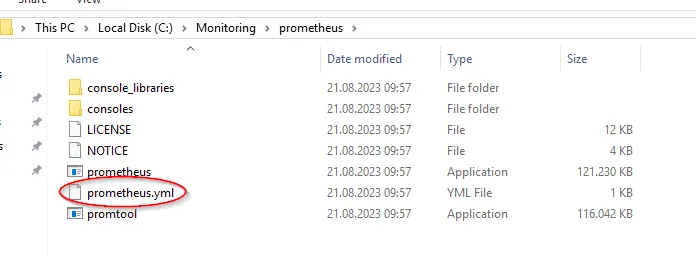
Create a directory, e.g., ‘C:\Monitoring\prometheus’, and extract the downloaded .zip file here.
Directory
Create a configuration file named ‘prometheus.yml’.
prometheus.yml
In ‘prometheus.yml’, define your targets (your Windows Servers) and the metrics you want to monitor. Here, we’re defining ‘localhost:9182’ to collect metrics from our existing server. We’ll install the WMI Exporter in later steps.
Example ‘prometheus.yml’ configuration:
# Global configglobal:scrape_interval:15sevaluation_interval:15sscrape_configs:-job_name:"prometheus"static_configs:-targets: ["localhost:9090"]
-job_name:"WMI_Exporter"static_configs:-targets: ["localhost:9182"]
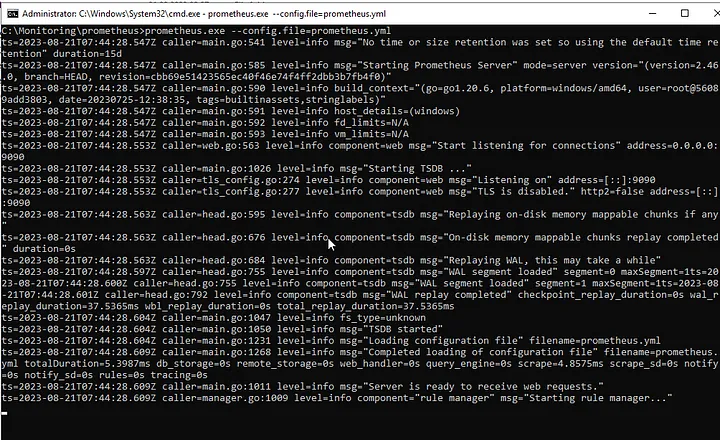
Start Prometheus by running the following command in the relevant directory: