
Continuing our guide, we will explore the process of setting up monitoring for Microsoft SQL Server (MSSQL) in your Windows Server environment. Monitoring your MSSQL instance is crucial for maintaining database performance, identifying bottlenecks, and ensuring optimal operations.
Here’s how to perform this comprehensive monitoring:
TL;DR
- Enable SQL Server Agent: Activate the SQL Server Agent for interaction with external collectors such as Prometheus.
- Install Prometheus Windows Exporter: Download and install the Prometheus Windows Exporter from GitHub.
- Set Up Prometheus Scraper/Database: Install Prometheus on your monitoring server/computer and configure the scraper.
- Access Prometheus Server and Add Targets: Access the Prometheus server through a browser and add a new target.
- Query SQL Server Processes: Execute the necessary query to query SQL Server processes.
- Install Grafana and Connect to Prometheus: Install Grafana, connect it to the Prometheus server, and visualize the data.
In our previous article, you can find information on how to perform monitoring on a Windows server.
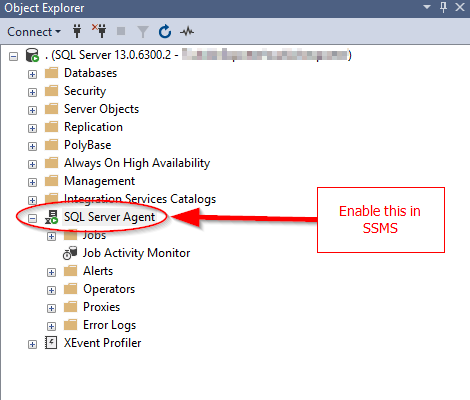
- Enable SQL Server Agent in SSMS:
- To allow external collectors (e.g., Prometheus) to query the SQL Server engine, enable the SQL Server Agent.
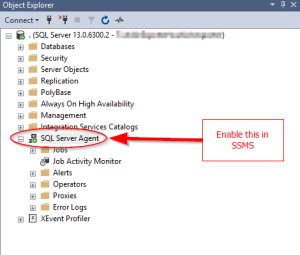
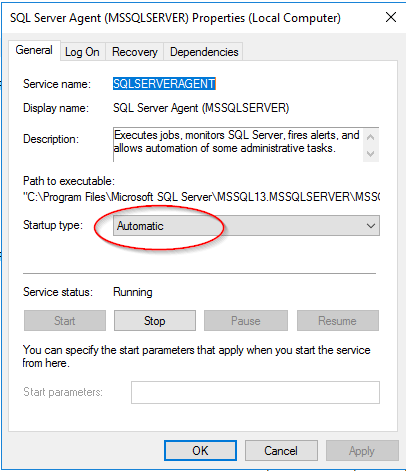
SQL Server Agent - Change the startup type of the SQL Server Agent service to “Automatic” so that it starts automatically upon system startup.
2.Install Prometheus Windows Exporter:
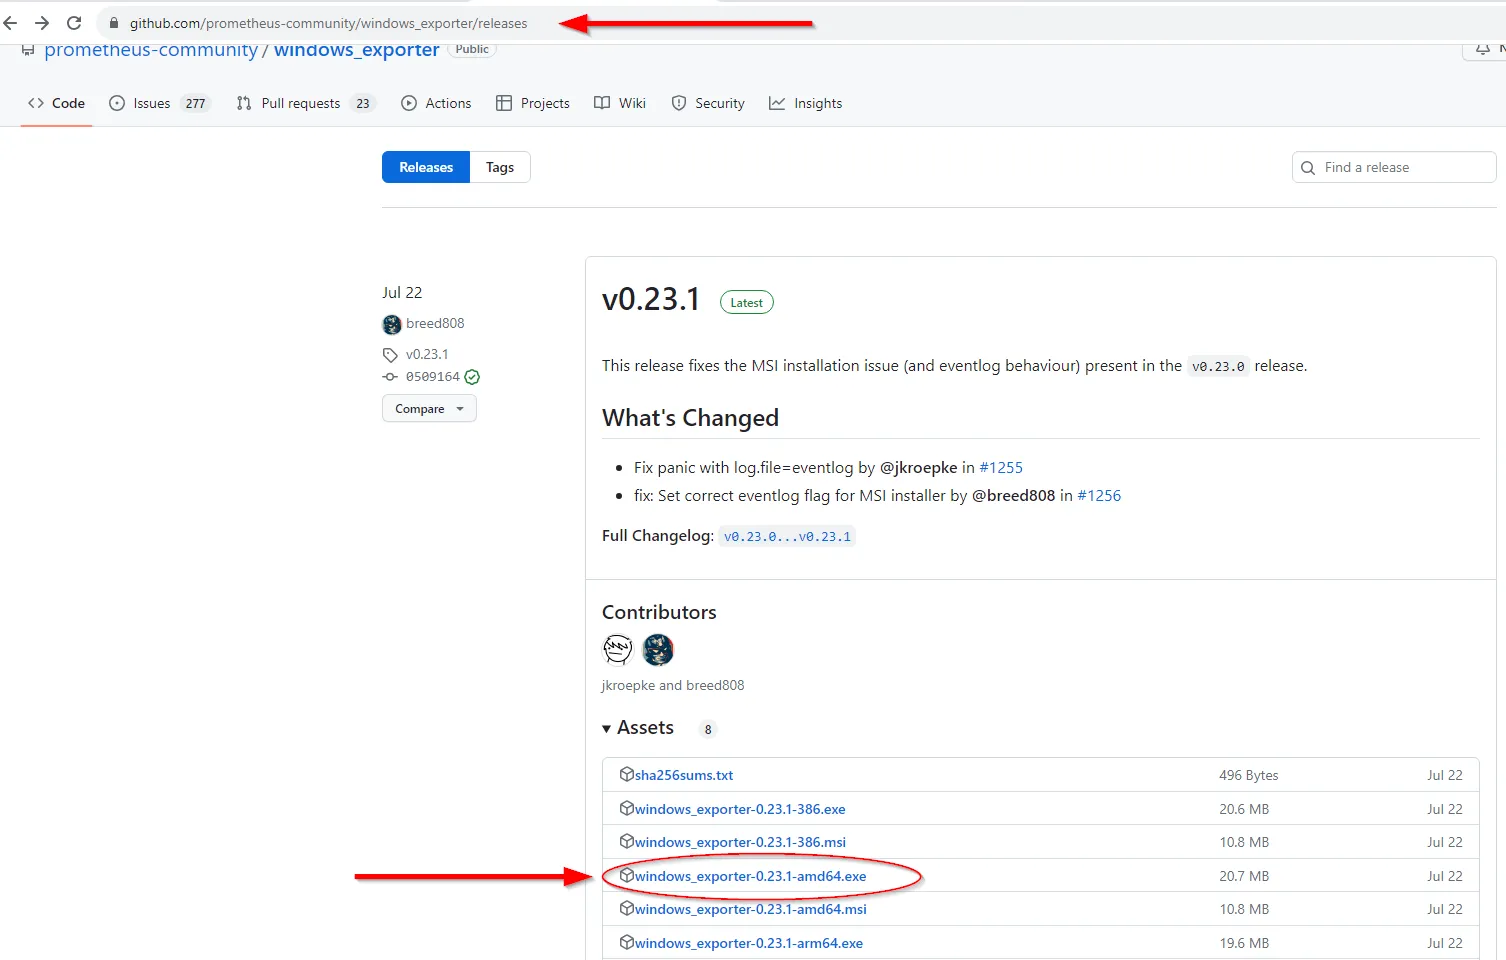
- Download the Prometheus Windows Exporter from GitHub.
- Use the installer found in the “Assets” section to install the exporter.
- You can use the default Windows node exporter provided by Prometheus, which includes basic SQL Server metrics. No additional exporter installation is needed.
- Install the exporter using the MSI installer.
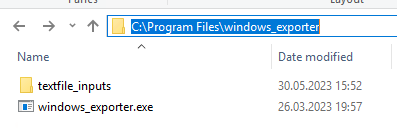
- After installation, the binary will be located in the
C:\Program Files\windows_exporterfolder. 
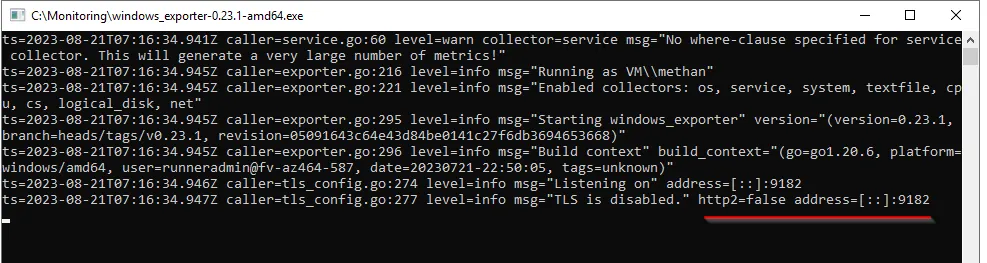
- If a process/task named “windows_exporter” is running, terminate it, as we will need to manually start the exporter with some additional flags.
- Manually run the exporter with the following command to fetch SQL Server statistics:
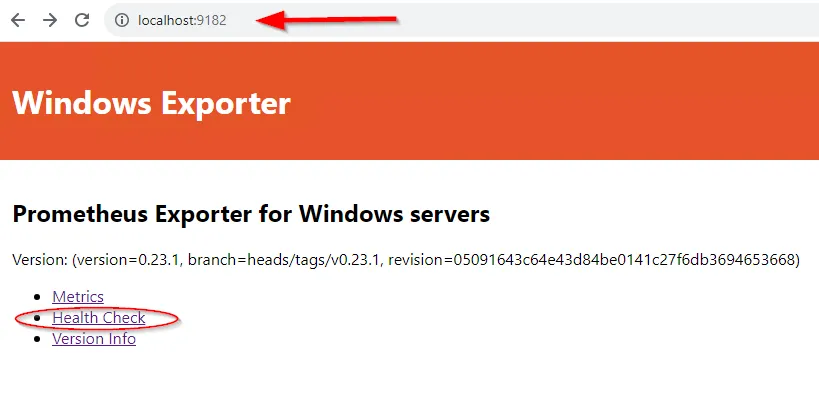
C:\Program Files\windows_exporter\windows_exporter.exe --collectors. Enabled="cpu,cs,logical_disk,net,os,service,system,textfile,mssql"- Access http://localhost:9182/metrics in your browser to view available metrics.
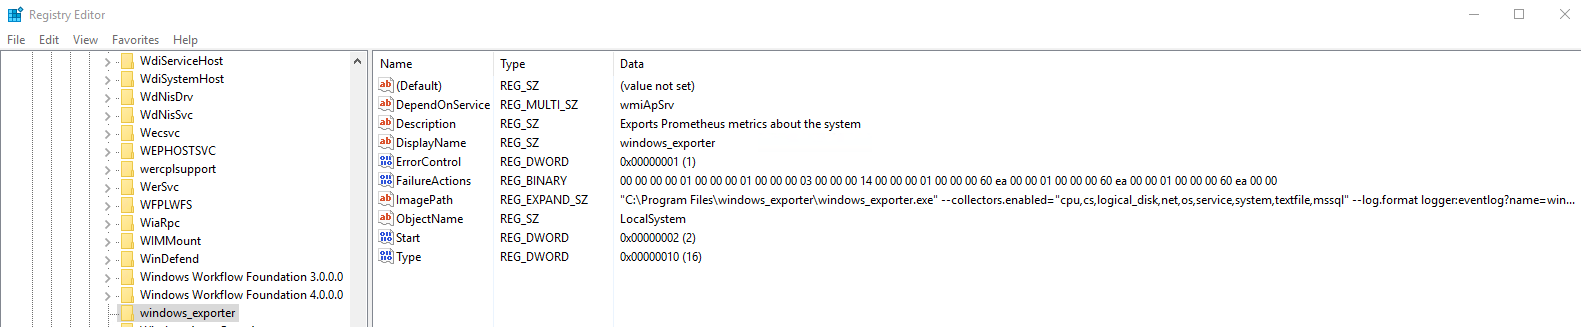
- To make the changes persistent, add the following settings to the registry:
"C:\Program Files\windows_exporter\windows_exporter.exe" --collectors.enabled="cpu,cs,logical_disk,net,os,service,system,textfile,mssql" --log.format logger:eventlog?name=windows_exporterSearch for “regedit” in the Start menu.
Open regedit.
HKEY_LOCAL_MACHONE/SYSTEM/Current ControlSet/Services/windows_exporterin the opened window and make the registry changes we provided above to the ‘ImagePath’.
3- Install Prometheus and Configure the Scraper:
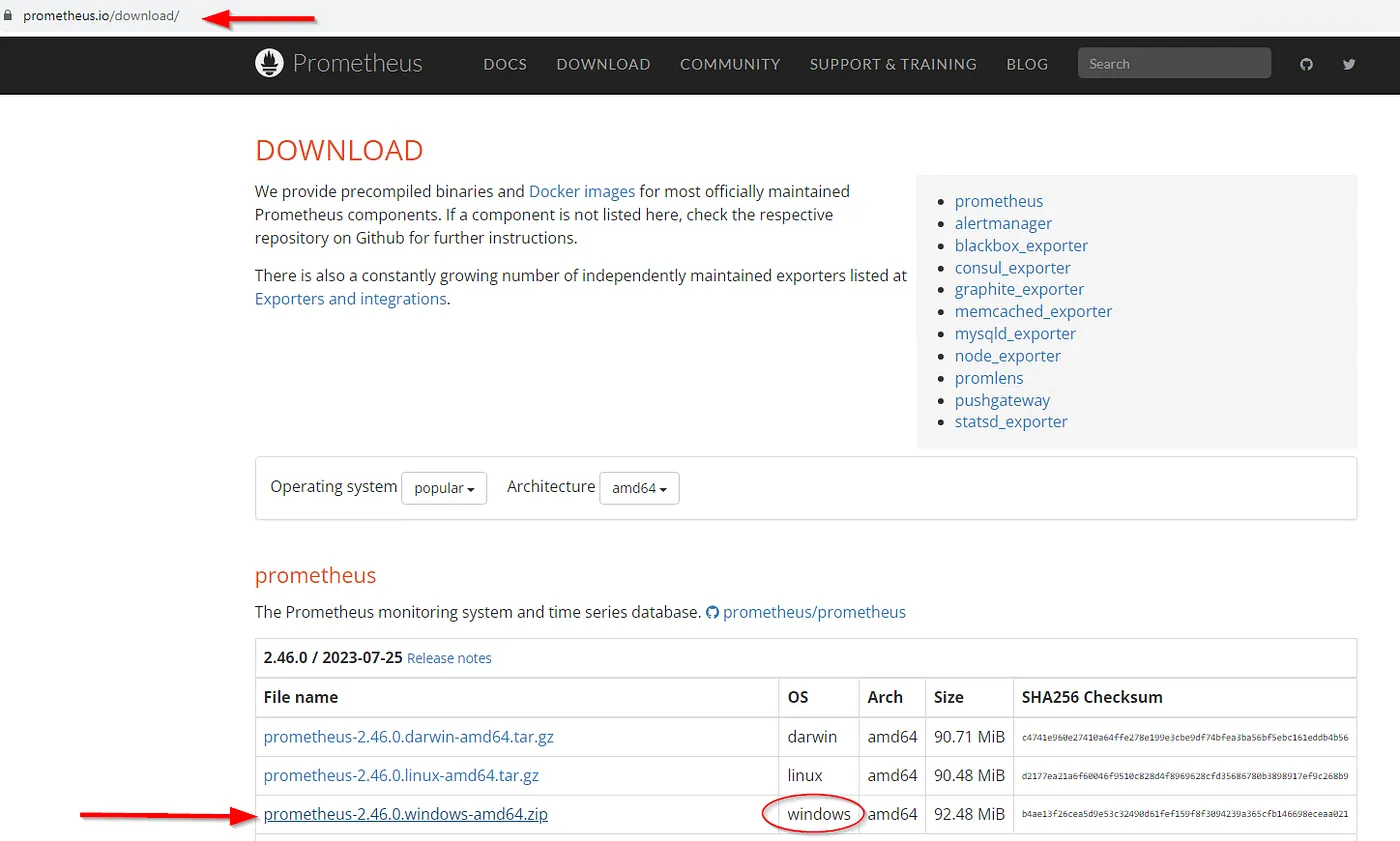
- Download the latest version of Prometheus from prometheus.io. ,
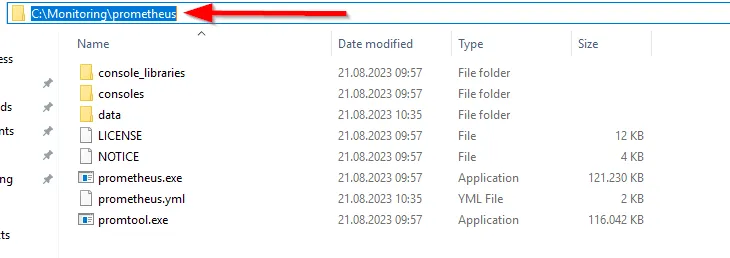
- Extract the downloaded .tgz file to an appropriate folder.
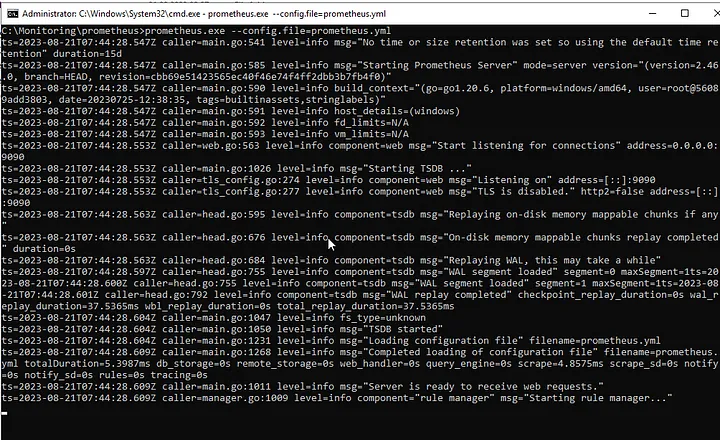
- Run the binary file named
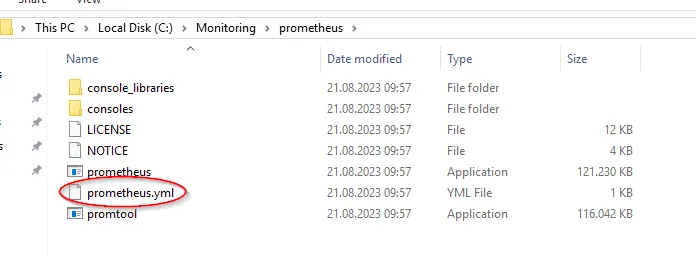
prometheus.exelocated in the extracted folder. - There will be a file named
prometheus.yamlin the directory where Prometheus is installed. - Open this file with a text editor. In the
static_configssection, add the IP address of the Windows server you want to add as a target.
Example:
 - job_name: "MSSQL_SERVER"

    # metrics_path defaults to '/metrics'
    # scheme defaults to 'http'.

    static_configs:
- targets: ["MSSQLSERVERIP:9182"]- Replace “MSSQLSERVERIP” with the actual IP address of your Windows server.
- Save and close the file.
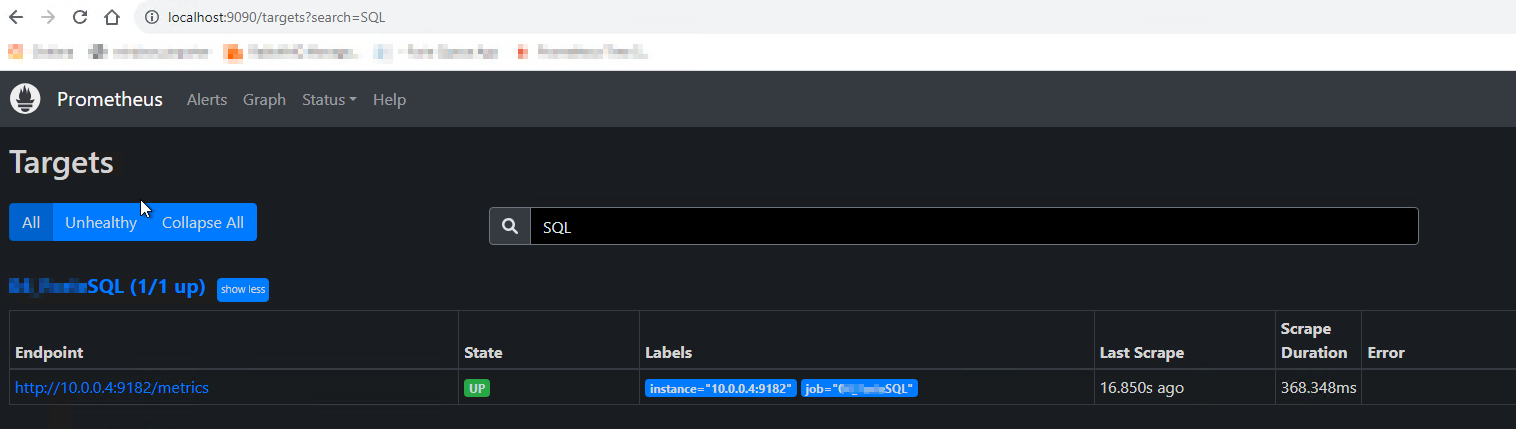
4.Access the Prometheus Server and Add Targets:
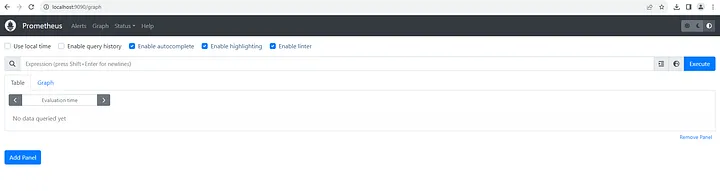
- Open a browser and go to
localhost:9090
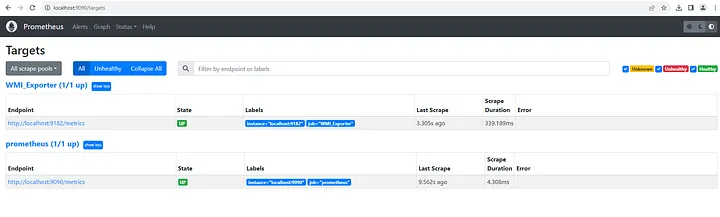
- In the Status -> Targets tab, make sure the target at
MSSQLSERVERIP:9182/metricsis UP.
5. Query SQL Server Processes Through Prometheus:
- Tarayıcınızı açın ve Prometheus sunucusuna gidin. Varsayılan olarak
localhost:9090.Open your browser and go to the Prometheus server. By default, it’slocalhost:9090 - Click on the “Console” tab in the upper left corner. This is where you can run PromQL queries.
- Query SQL Server processes by entering the following query:
rate(windows_mssql_sqlstats_batch_requests[30s]) * 60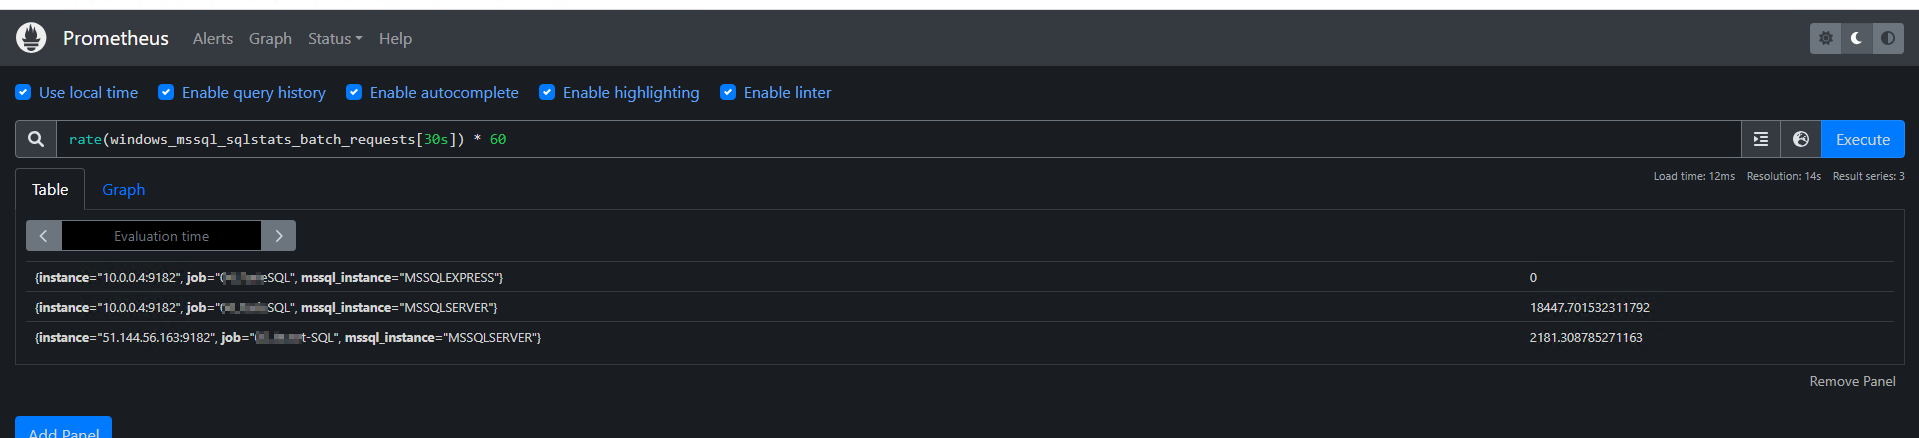
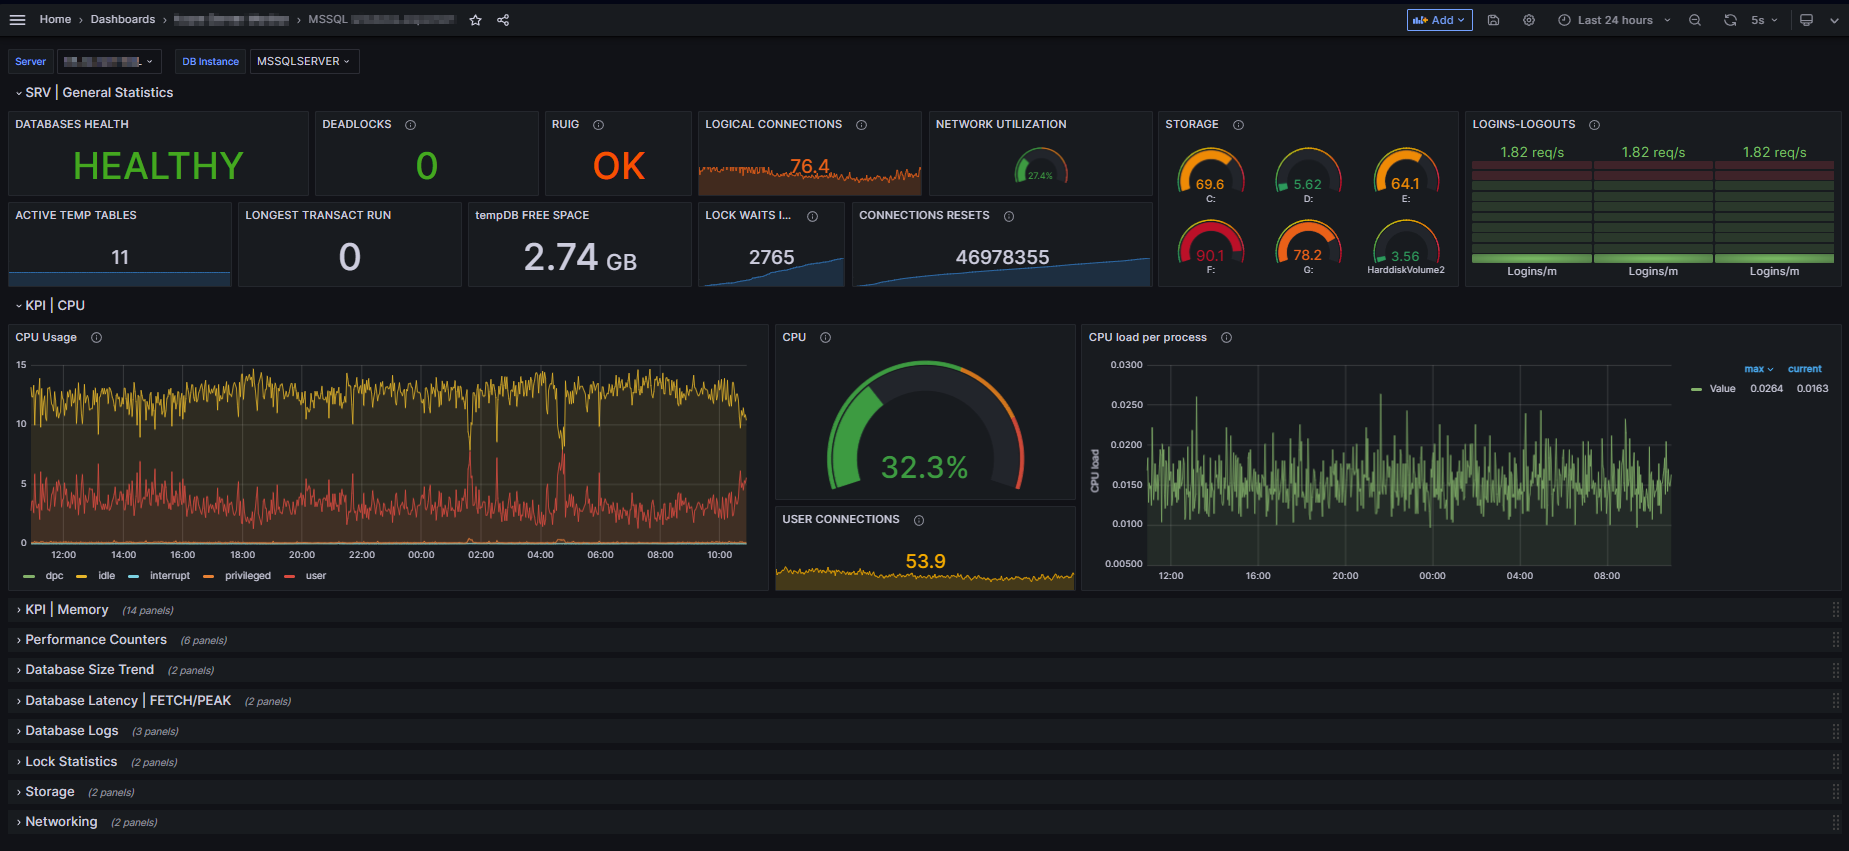
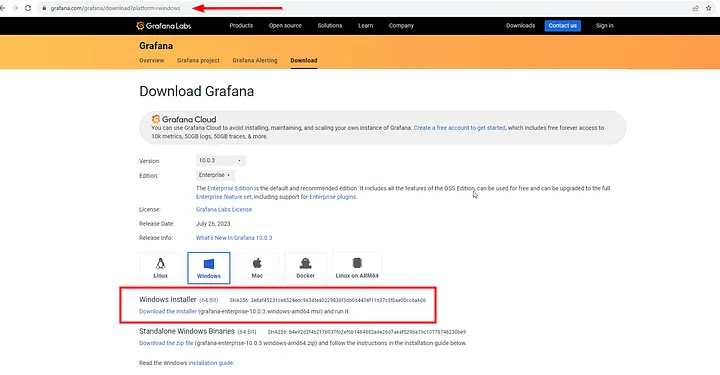
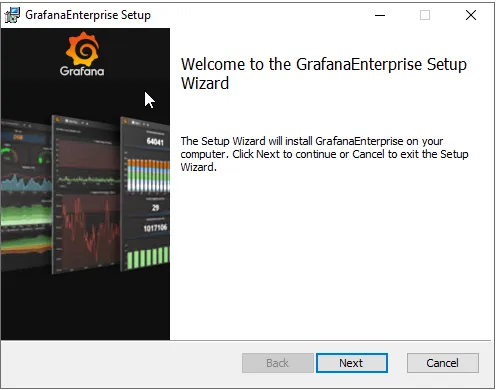
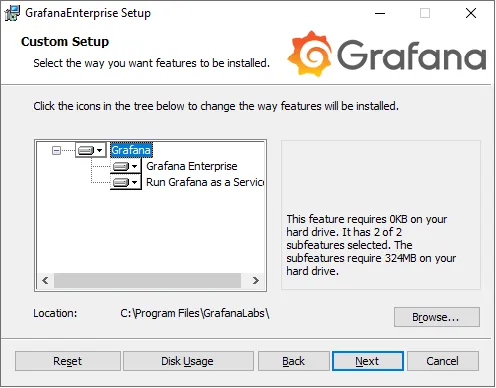
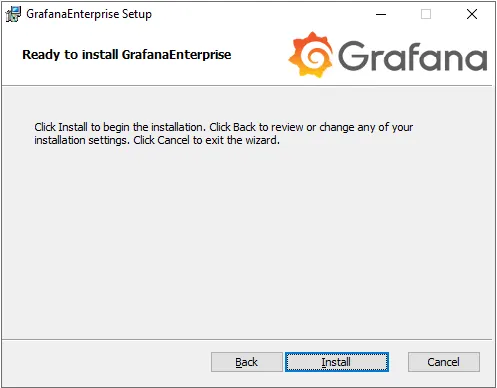
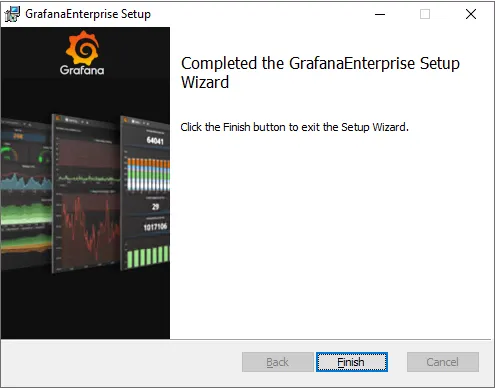
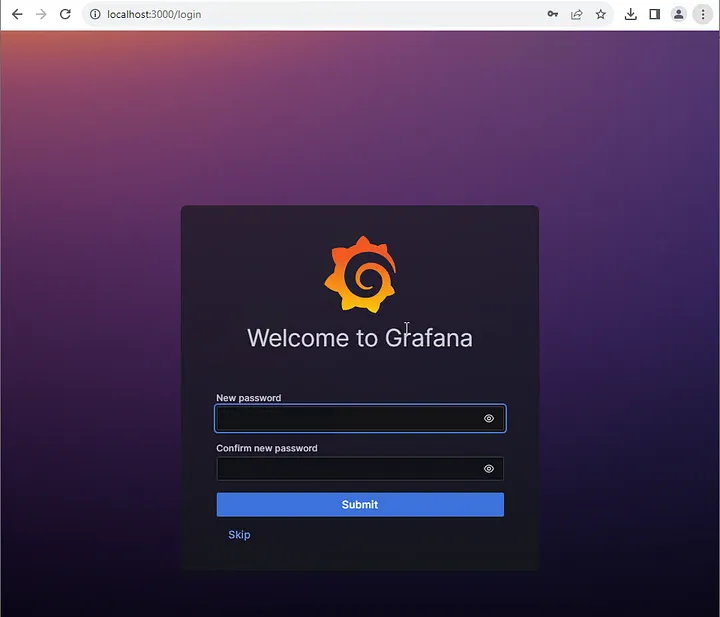
6.Install Grafana and Connect to Prometheus:
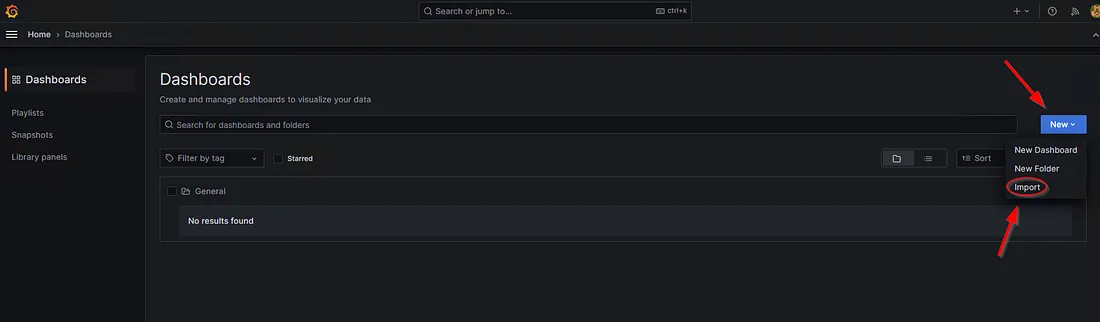
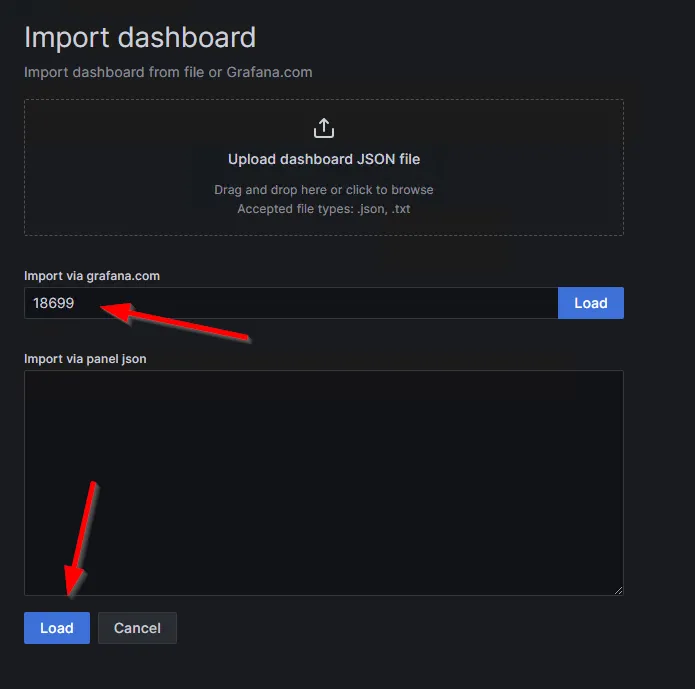
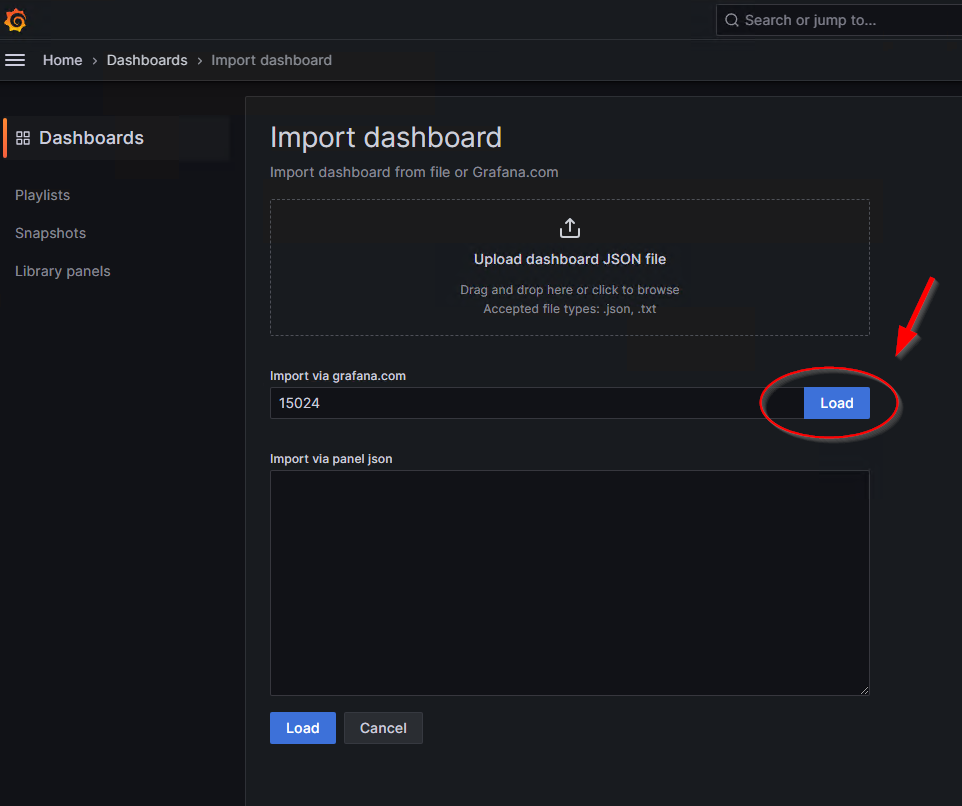
- Install Grafana and access the interface at
localhost:3000. - Use the “Import” option to add the MSSQL Windows Exporter Dashboard theme. Enter ‘15024’ as the ID in the “Import via grafana.com” section and proceed with “Load.”
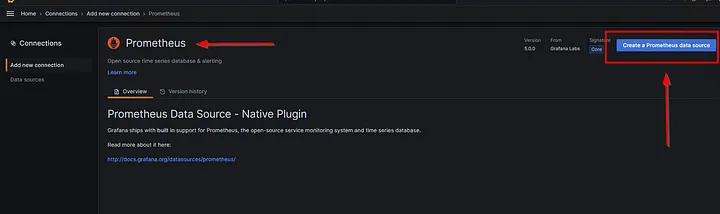
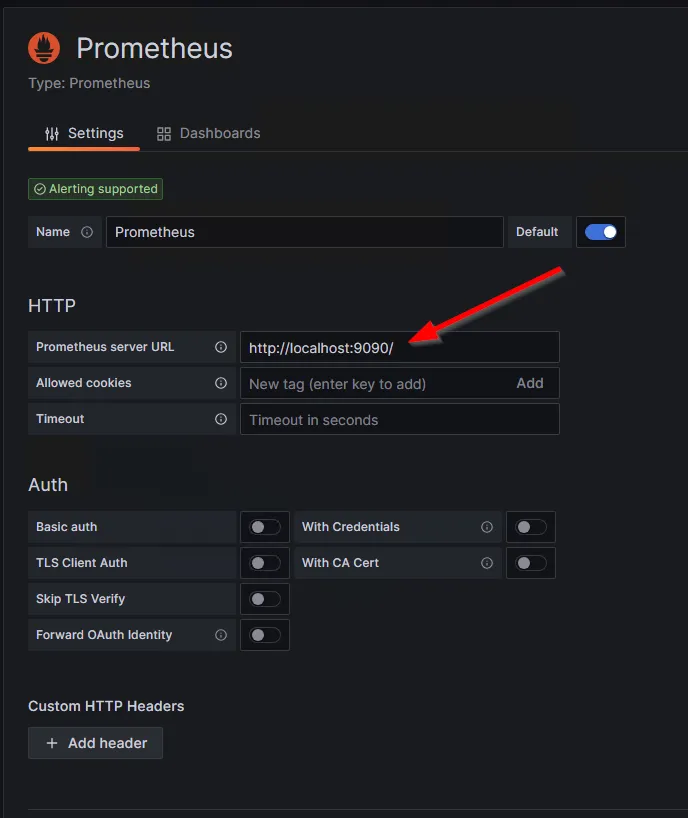
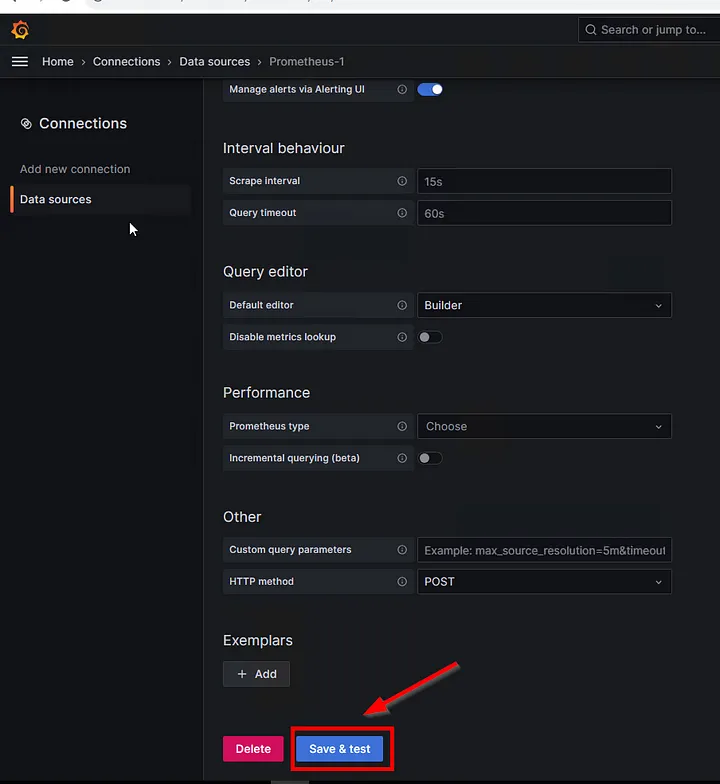
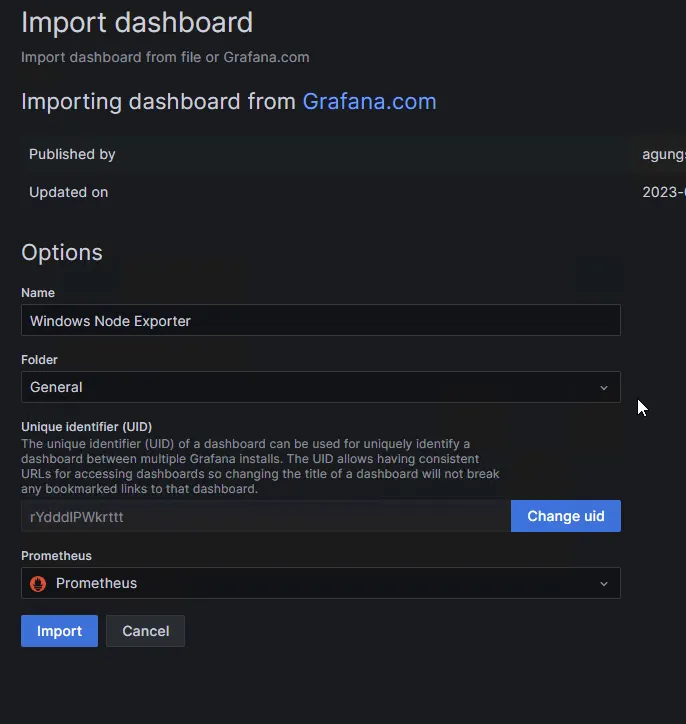
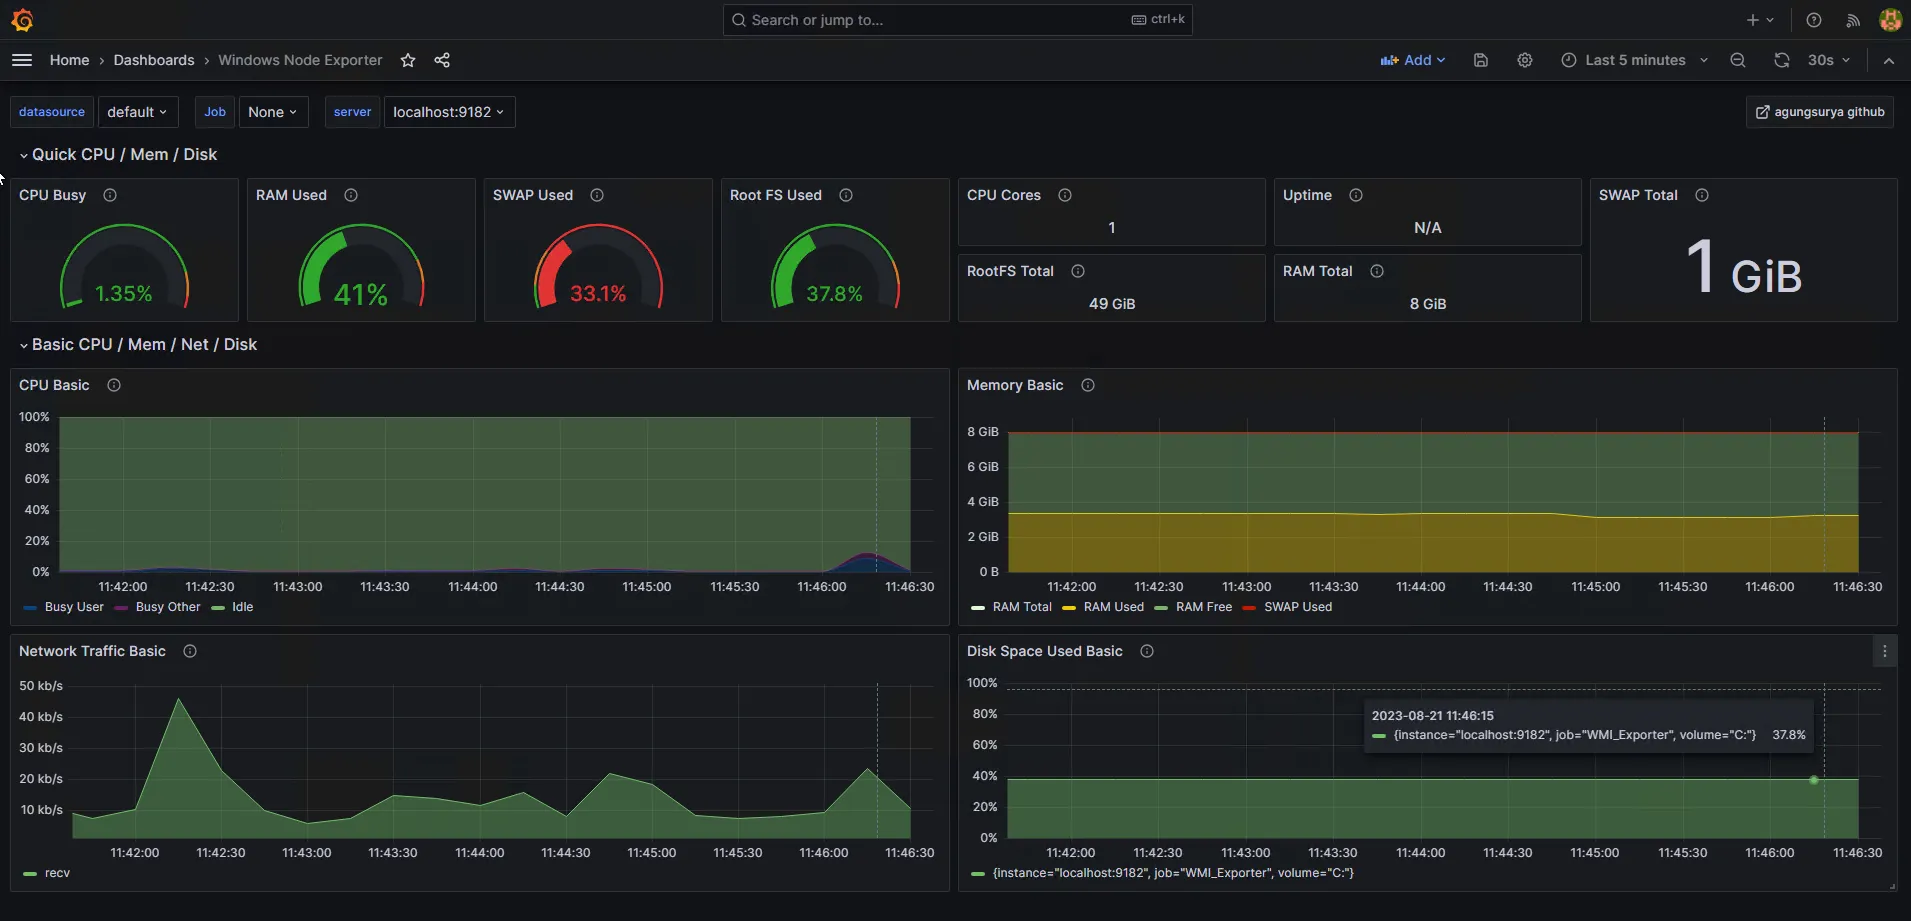
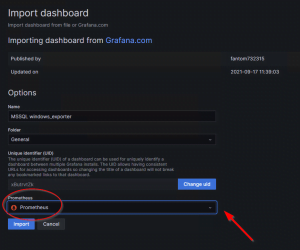
- In the “Data Sources” section, add the “Prometheus” data source and “Import” it.
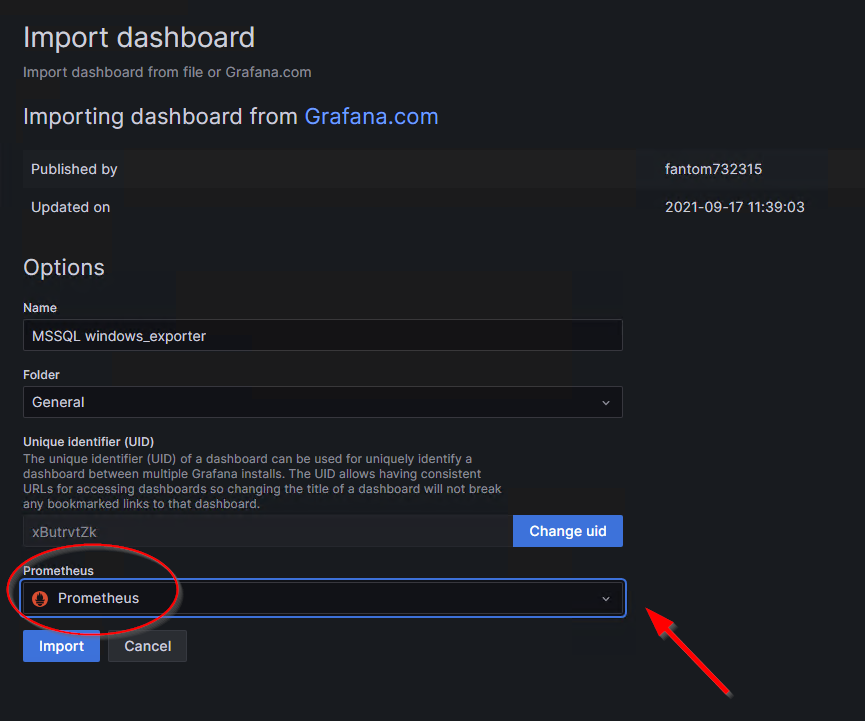
- Now, you can visually examine SQL Server statistics in the added dashboard.