
RabbitMQ is message queuing software that plays a significant role in distributed systems. You can access the article where I explain the RabbitMQ installation from here. You can use tools like Prometheus, Grafana, and WMI Exporter to monitor and analyze the performance of RabbitMQ servers in a Windows Server environment. Here is a step-by-step guide:
Step 1: Enabling the Built-in Plugin for RabbitMQ with Prometheus Support
RabbitMQ comes with built-in Prometheus and Grafana support.
The rabbitmq_prometheus plugin provides Prometheus metric collector support. It exposes all RabbitMQ metrics in Prometheus text format on a specific TCP port.
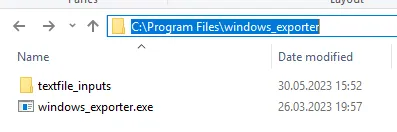
- If the plugin is not already installed, navigate to the rabbitmq directory on your system and check the plugins folder for the
rabbitmq_prometheusplugin.
If it’s not there, you can find the plugin in the official RabbitMQ plugin repository.
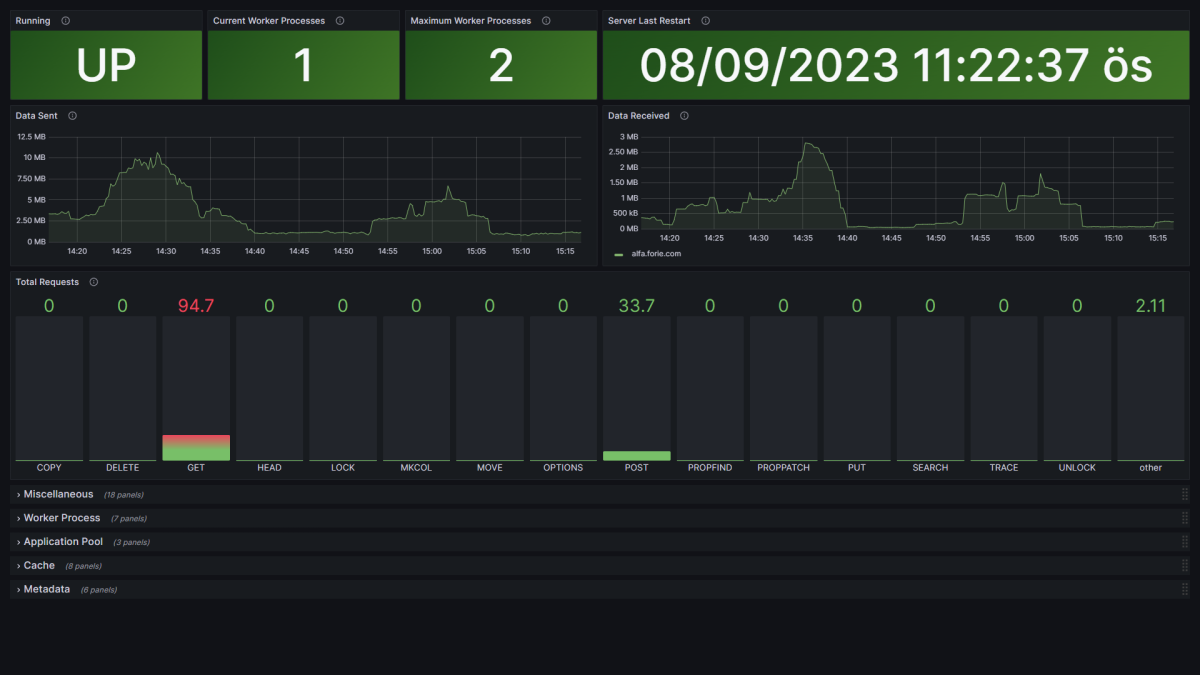
In our previous article, you can find information on how to perform monitoring on a Windows server
![]()
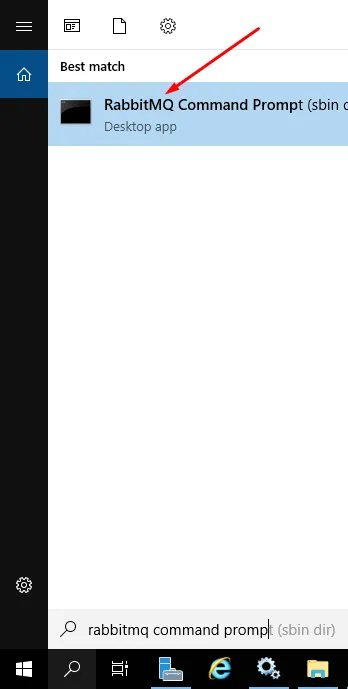
- Open the RabbitMQ Command-Line Client.
- Enable the plugin by entering the following command:
rabbitmq-plugins enable rabbitmq_prometheus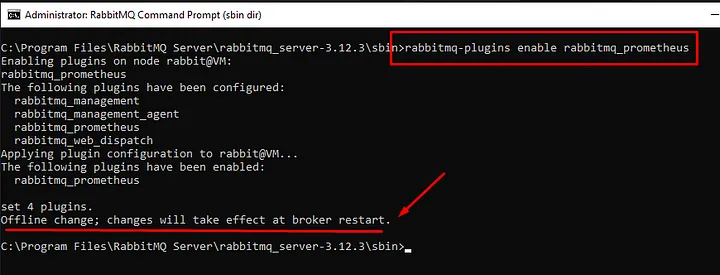
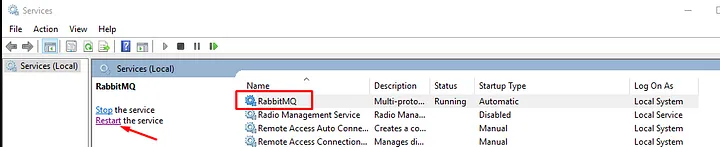
- After enabling the plugin, you might need to restart the RabbitMQ server to activate it. To restart the server, access the service management, select RabbitMQ, and click on the restart button.
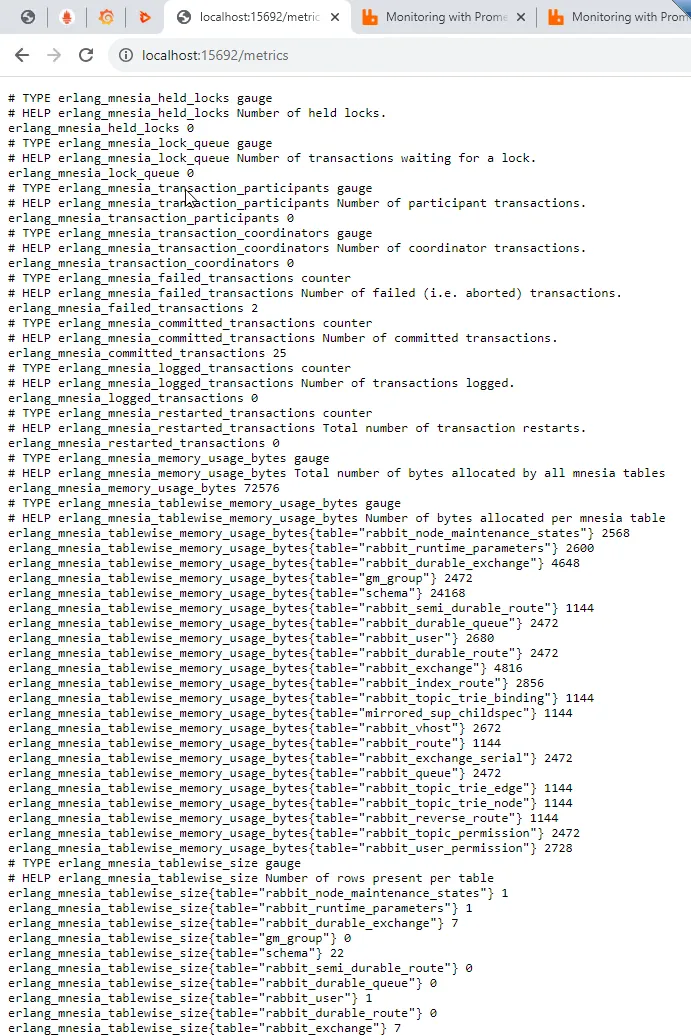
- Finally, check the metrics by going to the address
localhost:15962/metrics
Step 2: Installation and Configuration of Prometheus
- Download and install Prometheus on your Windows Server.
- Create a configuration file named
prometheus.yml. - In the
prometheus.ymlconfiguration file, add a scrape “job” to monitor RabbitMQ:
scrape_configs:
- job_name: 'rabbitmq'
static_configs:
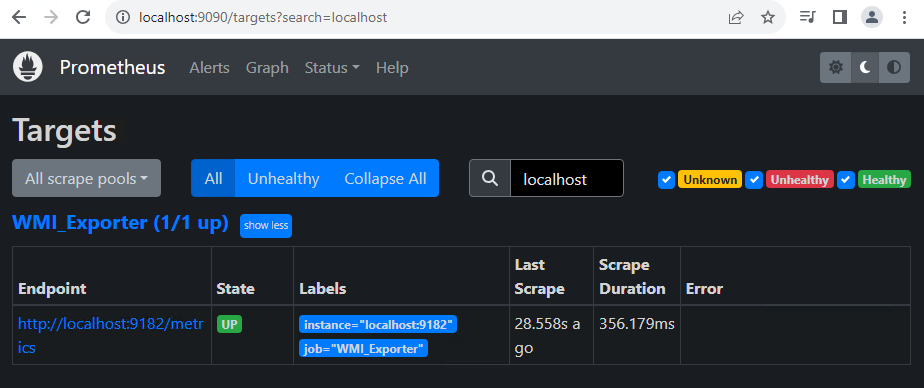
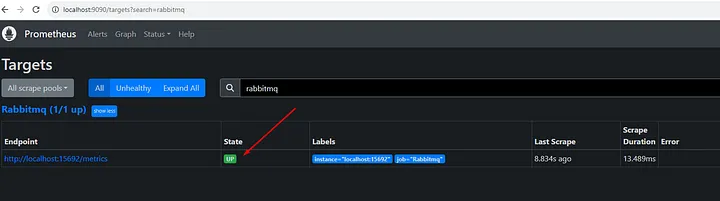
- targets: ['rabbitmq-sunucu:15672'] # RabbitMQ Yönetim Arayüzü adresi- Verify the RabbitMQ connection added in the Prometheus web interface at
localhost:9090. Check the Status/Targets section to ensure the RabbitMQ scrape target is present.
Step 3: Installation and Configuration of Grafana
- Download and install Grafana on your computer.
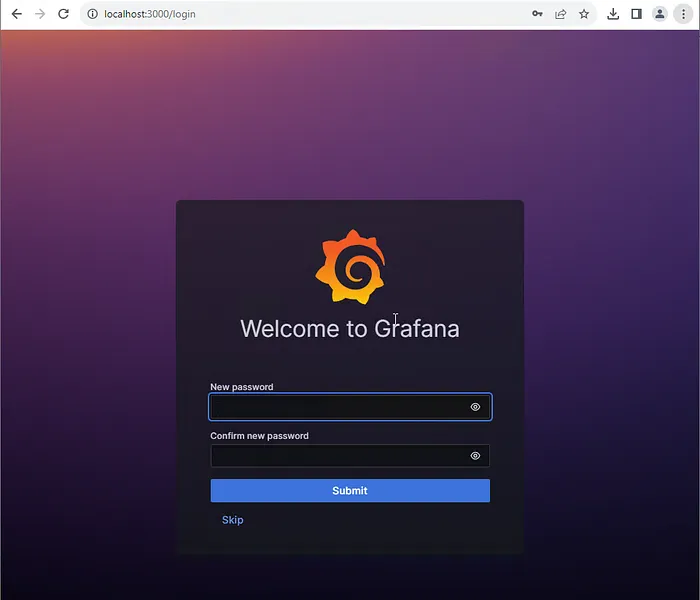
- Access the Grafana interface.
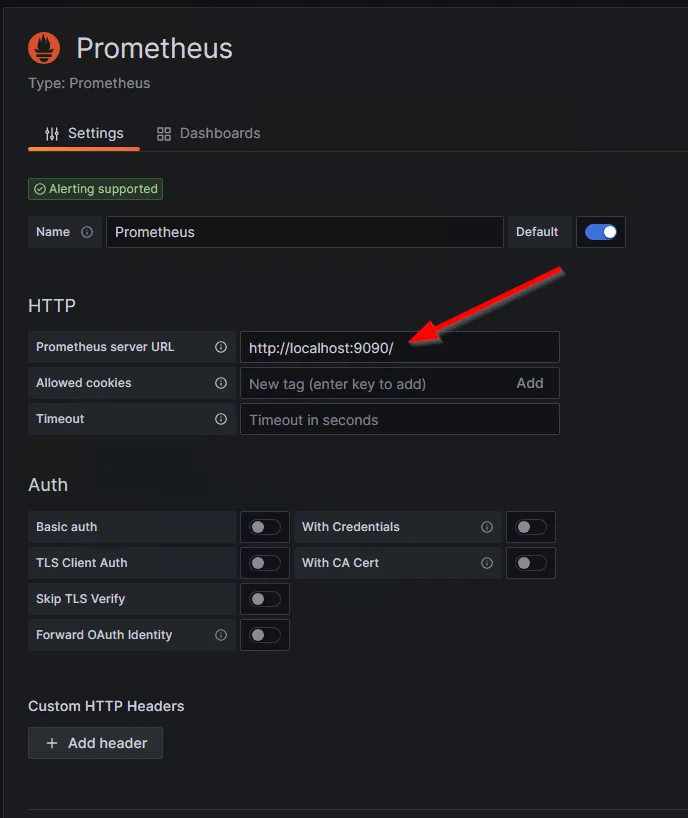
- Add Prometheus as a data source:
- Open the side menu by clicking on the gear icon or pressing “Ctrl + Shift + ,”.
- Go to “Data Sources”.
- Click on the “Add data source” button.
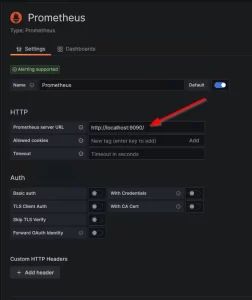
- Choose “Prometheus” from the list of available data sources.
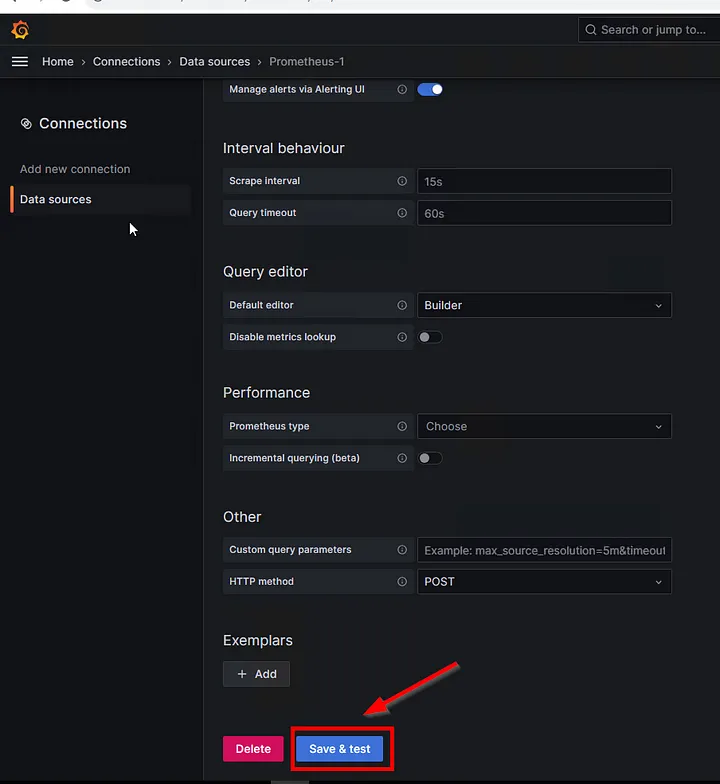
- Configure the Prometheus connection details and save the data source.
Step 4: Creating and Visualizing Grafana Dashboard (ID 10991)
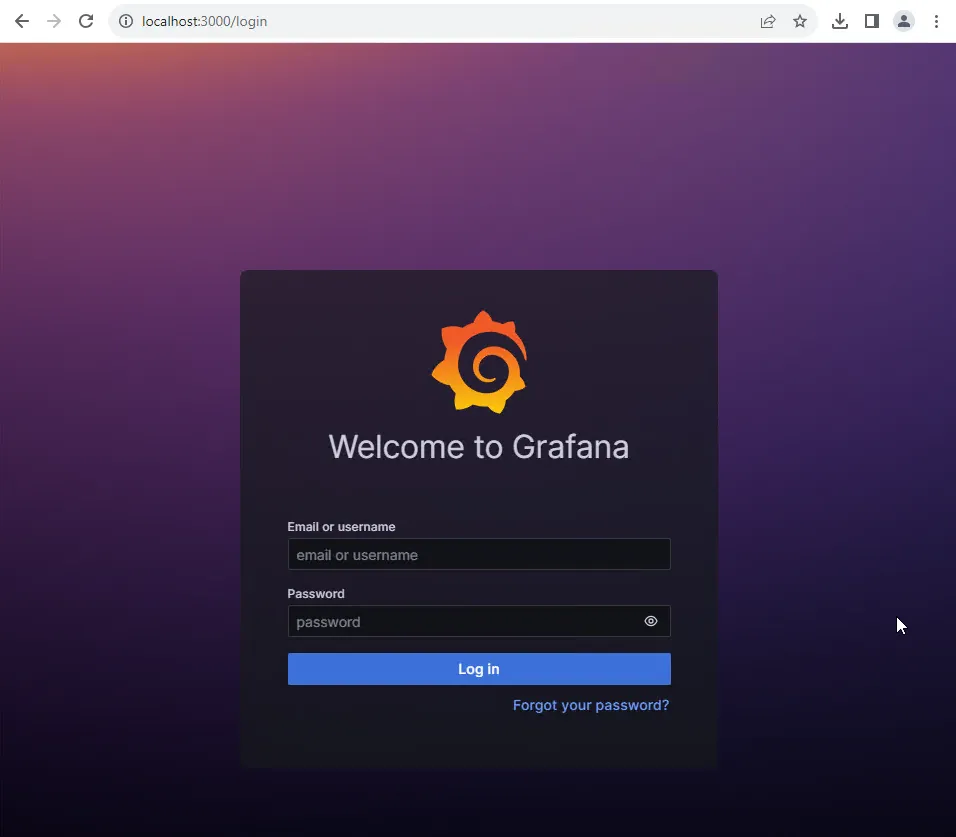
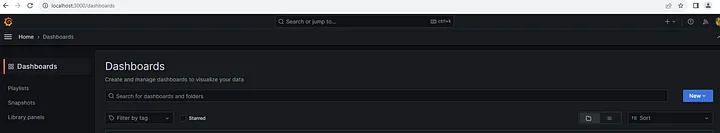
- Access the Grafana dashboard at
localhost:3000in your web browser.
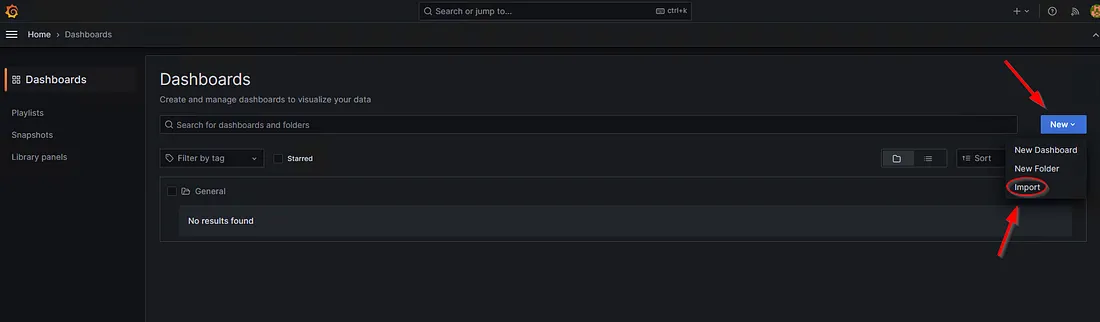
- Click on the “Home” icon in the left sidebar to access the home dashboard.
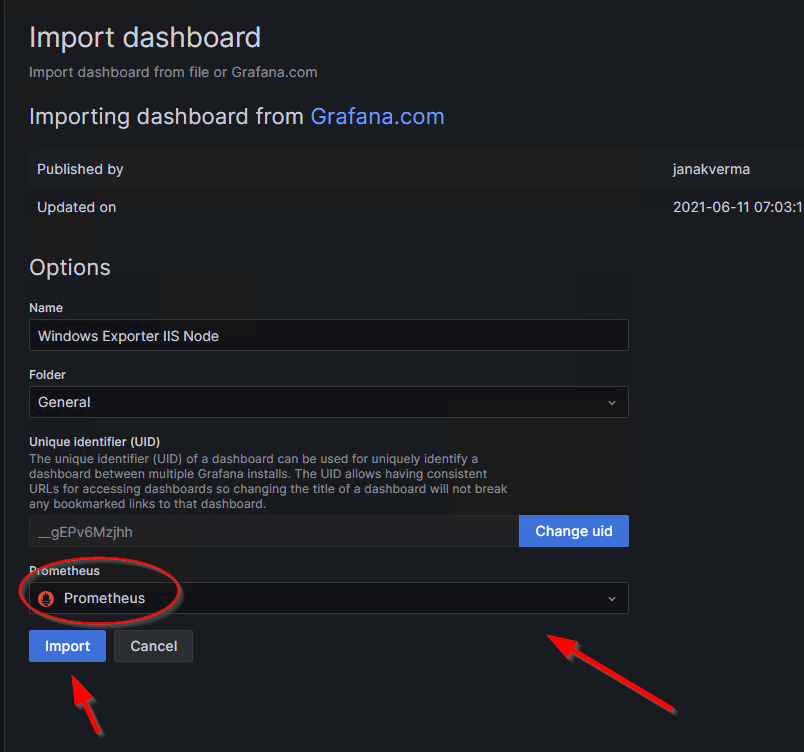
- Click on the “Import” button in the top menu.
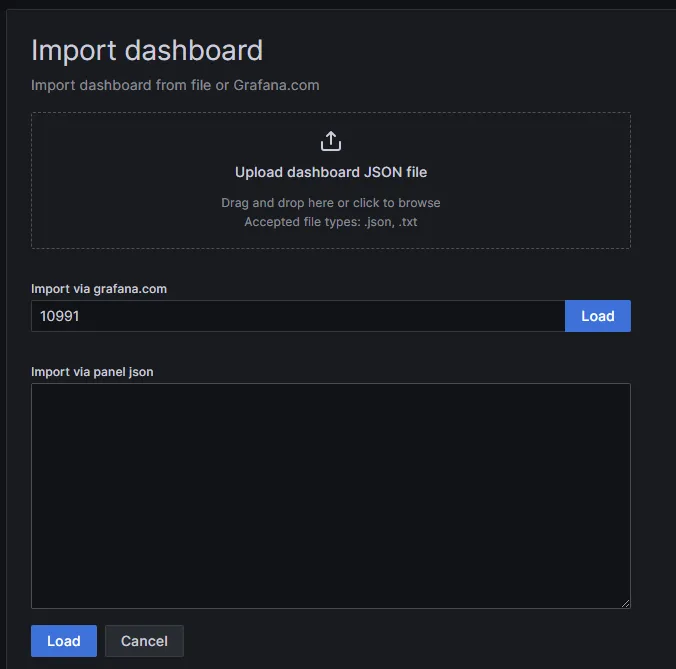
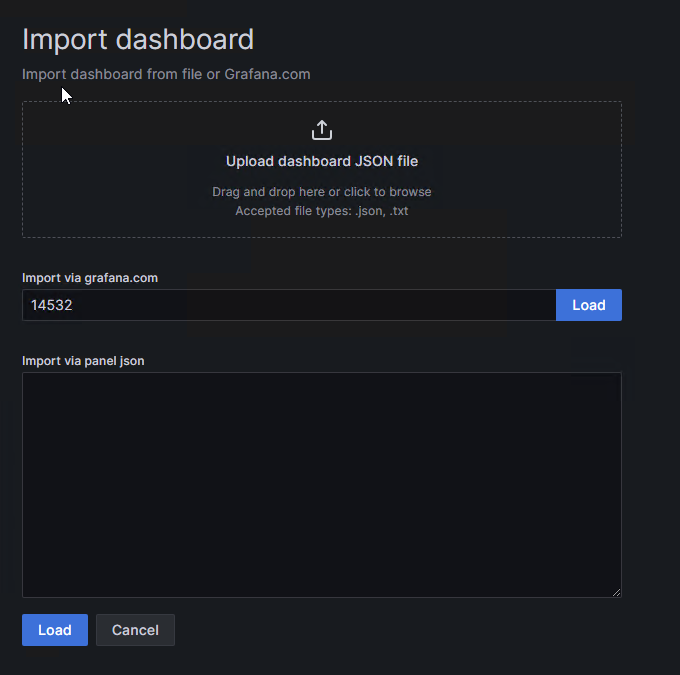
- Select the option “Import via grafana.com”.
- Enter the ID
10991in the appropriate field.
Note: We are installing the theme that RabbitMQ has officially published on its site.
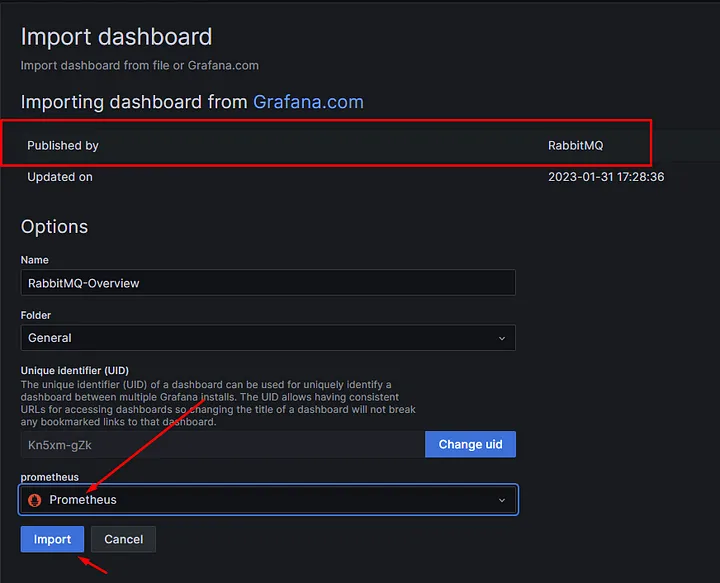
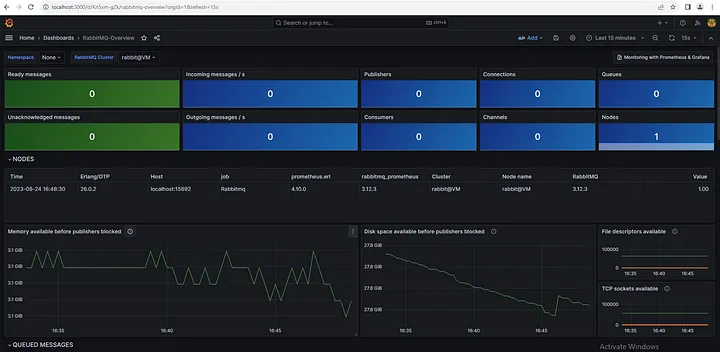
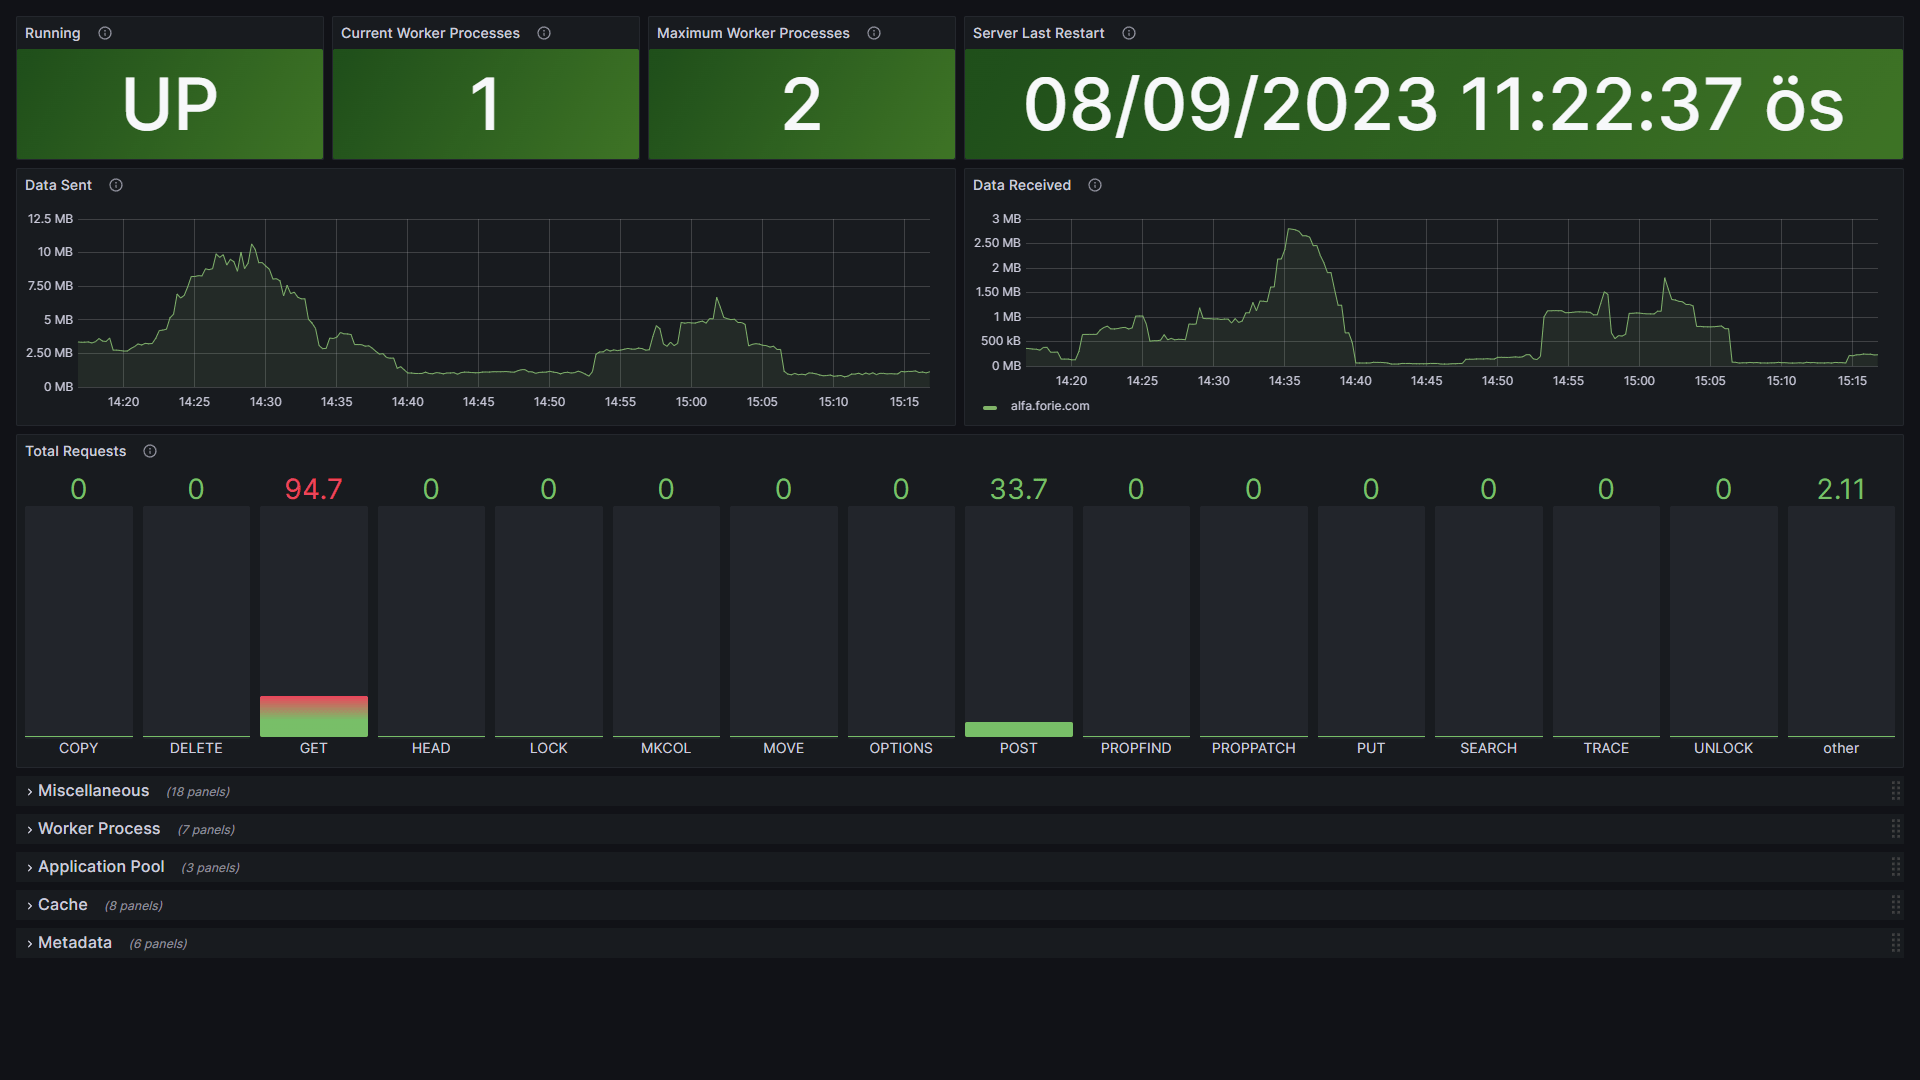
- The RabbitMQ monitoring dashboard example will be imported.
- Once imported, you’ll be able to view and interact with the RabbitMQ metrics visualization.