Automated File Cleaning in Windows
In today’s digital age, our computer storage can quickly become filled with unnecessary files over time. These files not only occupy space but can also impact system performance. Fortunately, Windows operating system provides a solution through the Task Scheduler, allowing you to automatically clean up such files, ensuring a faster and more organized computer experience.
In this guide, you’ll learn how to use the Windows Task Scheduler to automatically delete files in a specific folder at regular intervals. By minimizing the need for manual file cleaning, you can save time and utilize your computer more effectively. By following step-by-step instructions, you’ll discover how to set up this automated file cleaning process.
Understanding Task Scheduler
Let’s first take a look at the command we’ll be using: I can provide information about using the forfiles command to delete files older than a specified date. The “forfiles command is used on the Windows operating system to select files within a specific directory and perform actions on them. It’s commonly used to delete files older than a certain date.
forfiles /p "C:\dosya" /s /m *.* /D -6 /C "cmd /c del @path"Here’s the breakdown of this command:
/p "D:\folder": Specifies the directory to operate on./s: Searches through subdirectories as well./m *.*: Selects all file types./D -6: Filters files based on their modification date.-6selects files that are 6 days old or older./C "cmd /c del @path": Executes the specified command for each selected file. In this case,del @pathdeletes the file.
lease exercise caution when using this command! Accidentally deleting important files is possible. If you’re unsure, consider testing the command to observe how it works.
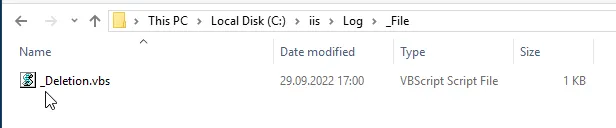
Creating a .bat File
Now, let’s create an example content for a .bat file:
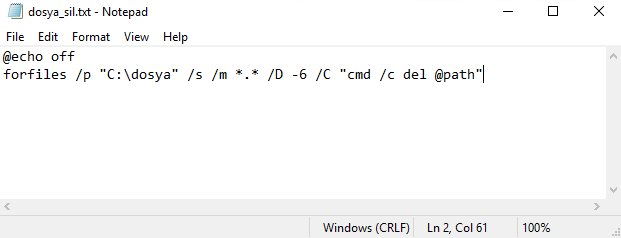
@echo off
forfiles /p "D:\dosya" /s /m *.* /D -6 /C "cmd /c del @path"
You can open a text editor, paste the code above, and save it with a desired name and .bat extension, such as file_cleanup.bat. Running this file will delete files older than the specified date in the designated folder. Caution is advised, as this operation irreversibly deletes files.
Using Task Scheduler
Using Task Scheduler to regularly execute the .bat file is straightforward. Here’s how:
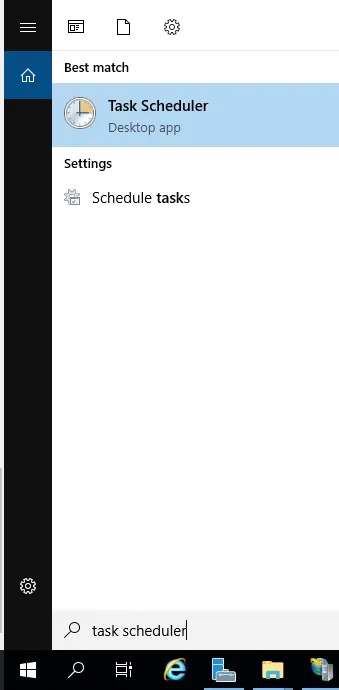
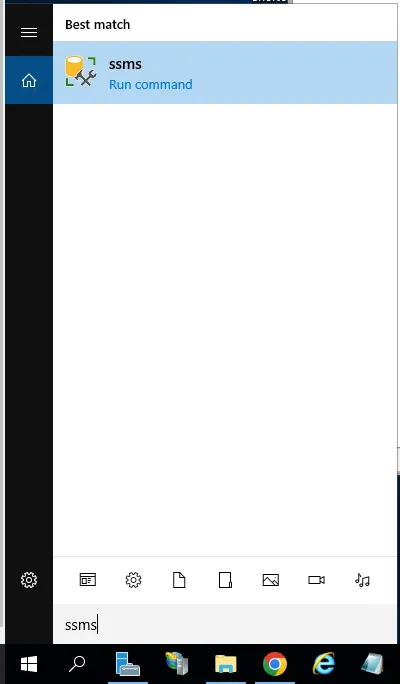
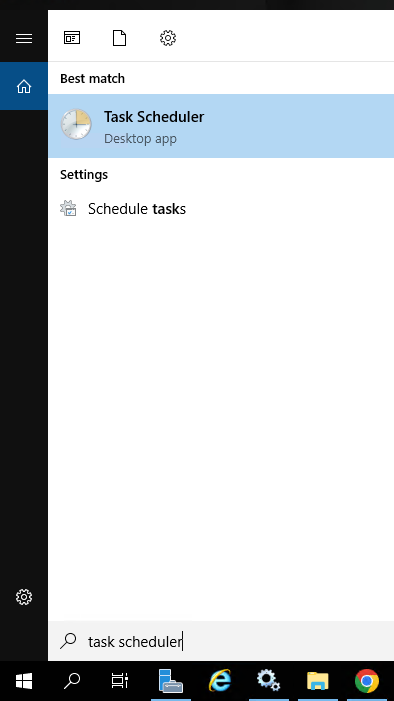
- Open the Start menu and search for “Task Scheduler,” then select it from the results.
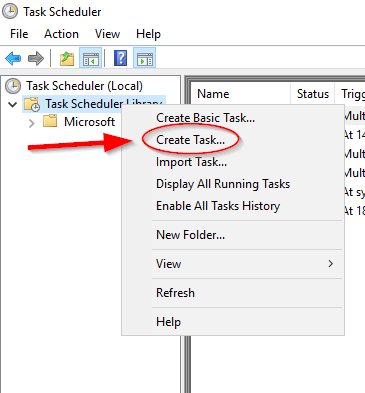
2.In the Task Scheduler window, click “Create Basic Task” on the right.
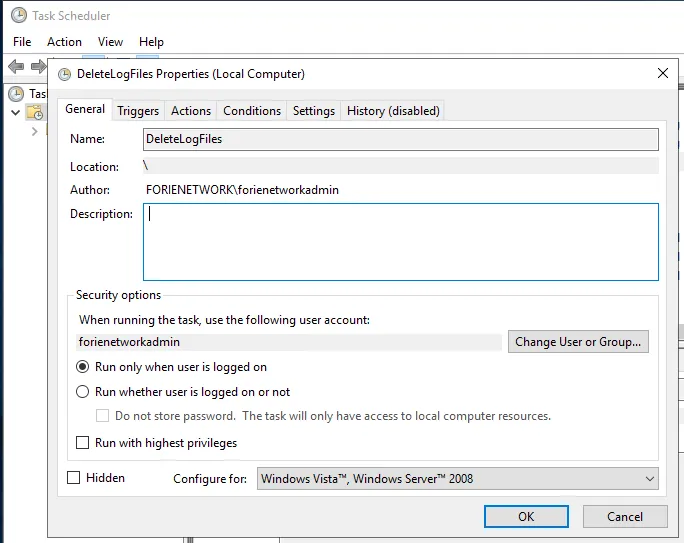
3.Follow these steps in the window that appears:
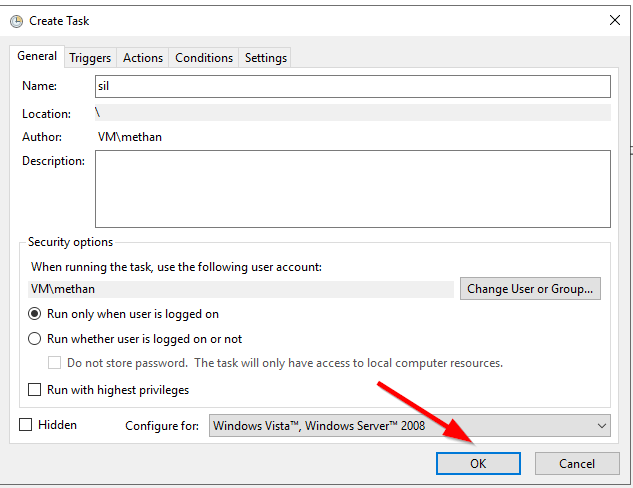
- Name and Description: Provide a name and optional description for the task.
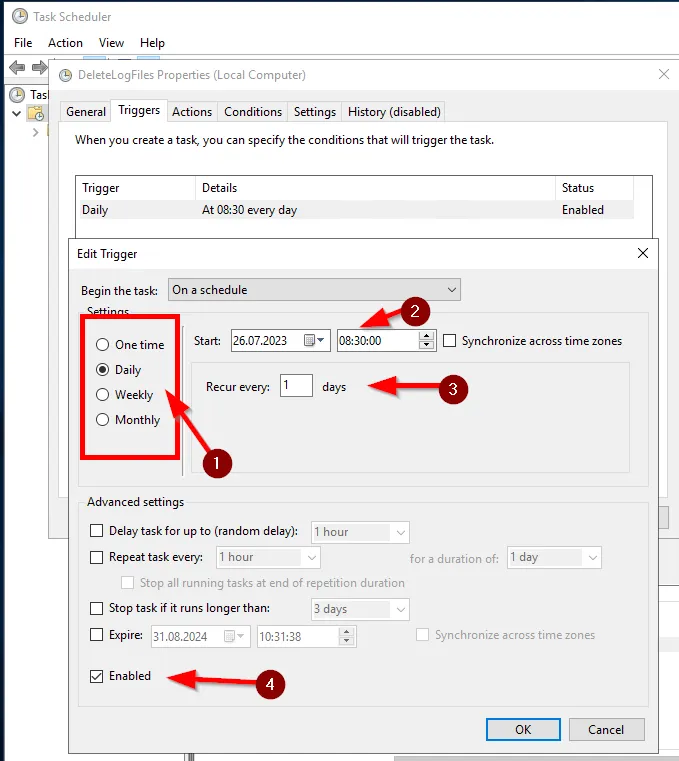
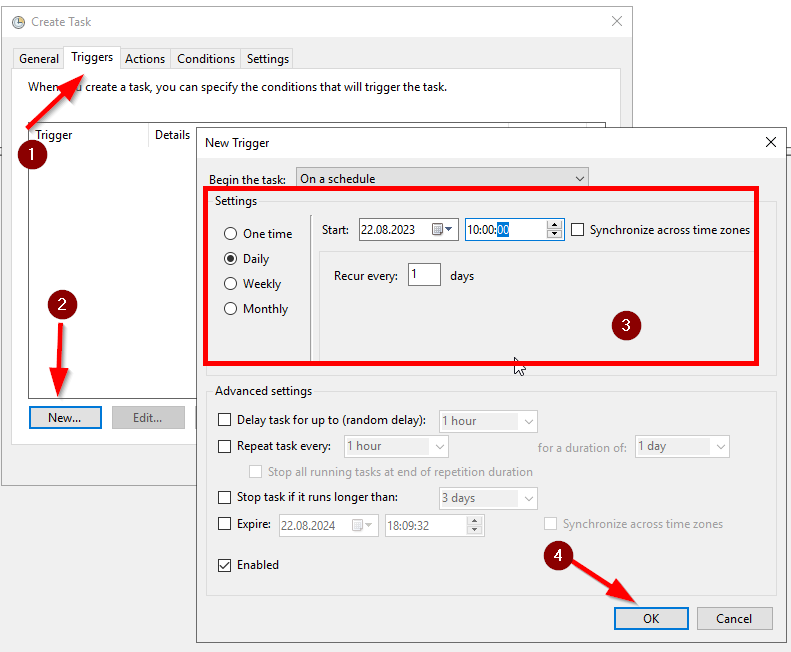
- Trigger: Choose when you want the task to start. For instance, select “When the task starts” and set the date and time.
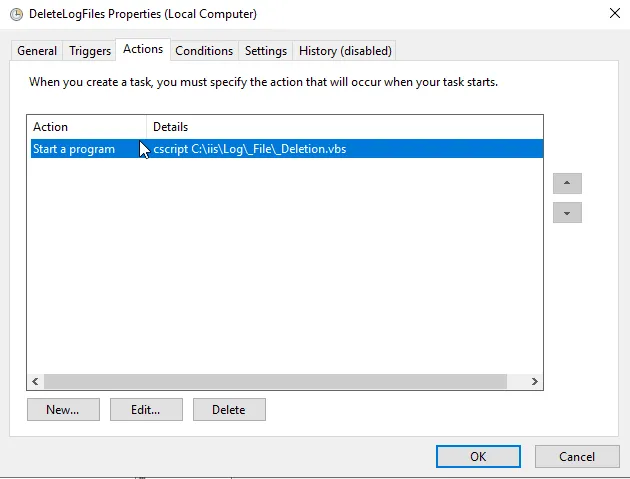
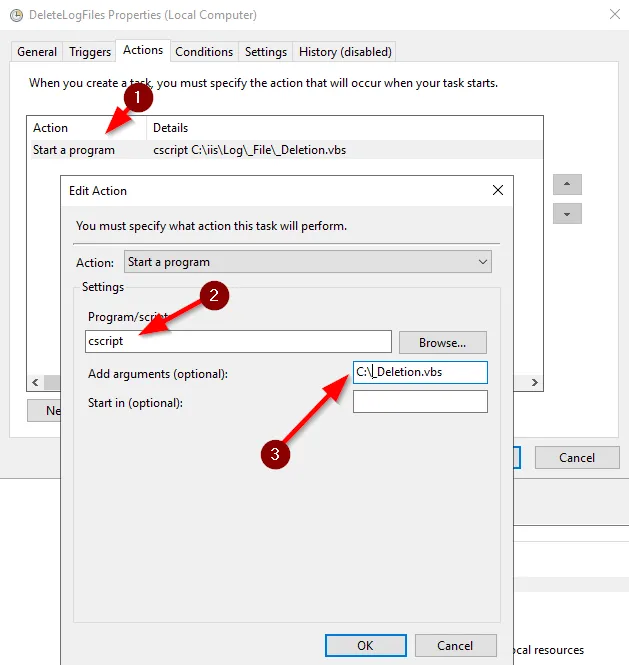
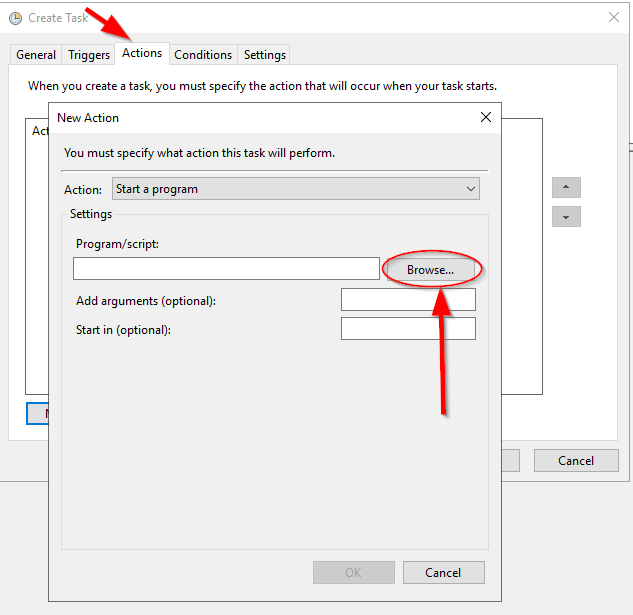
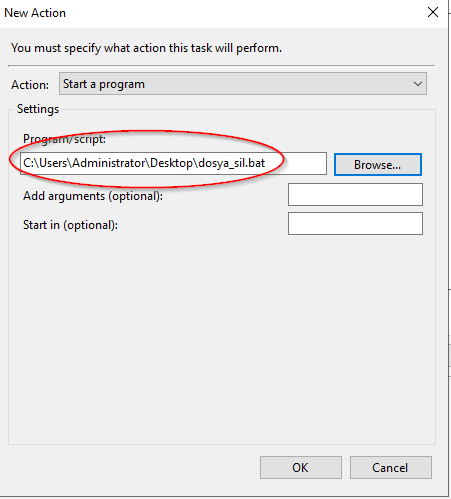
- Action: Choose “Start a program,” then browse to select the
.batfile you created. - Finish: Review your settings and click “Finish” to create the task.
The task will now run the .bat file automatically at the specified times. The flexibility of Task Scheduler allows you to easily customize when and how the file runs.
![]()
Remember, the information here is meant to guide you through the process of setting up automated file cleaning using the Windows Task Scheduler. Always exercise caution when deleting files, especially with automated processes.
If you have any questions or details you would like to add, feel free to write me.